Knowing your program is running is one thing. Knowing whether it's working is another. The loyalty dashboards in Analytics give you the data to answer that question — showing you whether guests are coming back more often, spending more and actively engaging with your rewards.
Use the dashboards to spot what's driving results, identify where engagement is dropping off and make confident decisions about your program rules.
ROLLER Loyalty is an add-on product, charged in addition to your monthly plan. Learn more.
Access the dashboards
From Venue Manager, go to Analytics > Dashboards. Use the dashboard selector at the top to switch between Loyalty Revenue Impact and Loyalty Program Engagement.
You can hover over any metric in the live dashboards to see its definition and how it is calculated. Read on for more details.
Dashboards or reports? Use the dashboards on this page for trends and revenue impact. For row-level detail you can filter and export — who enrolled, what they earned and what they redeemed — use the loyalty reports. See Track loyalty activity with loyalty reports.
Loyalty revenue impact dashboard
This dashboard helps answer the question: "Is loyalty generating more visits and more revenue for my business?"
Top 3 insights
Start with repeat visit rate. If it's low, the program isn't bringing guests back and the other metrics need more context before drawing conclusions.
Check whether loyalty guests are worth more than non-loyalty guests. The quarterly comparison charts show whether the spend and visit frequency gap is growing over time — a widening gap is the clearest signal the program is working.
Compare incremental revenue against rewards value used. This tells you whether the program is generating more booking value than it costs in discounts.
Top-level metrics
Metric | Definition |
|---|---|
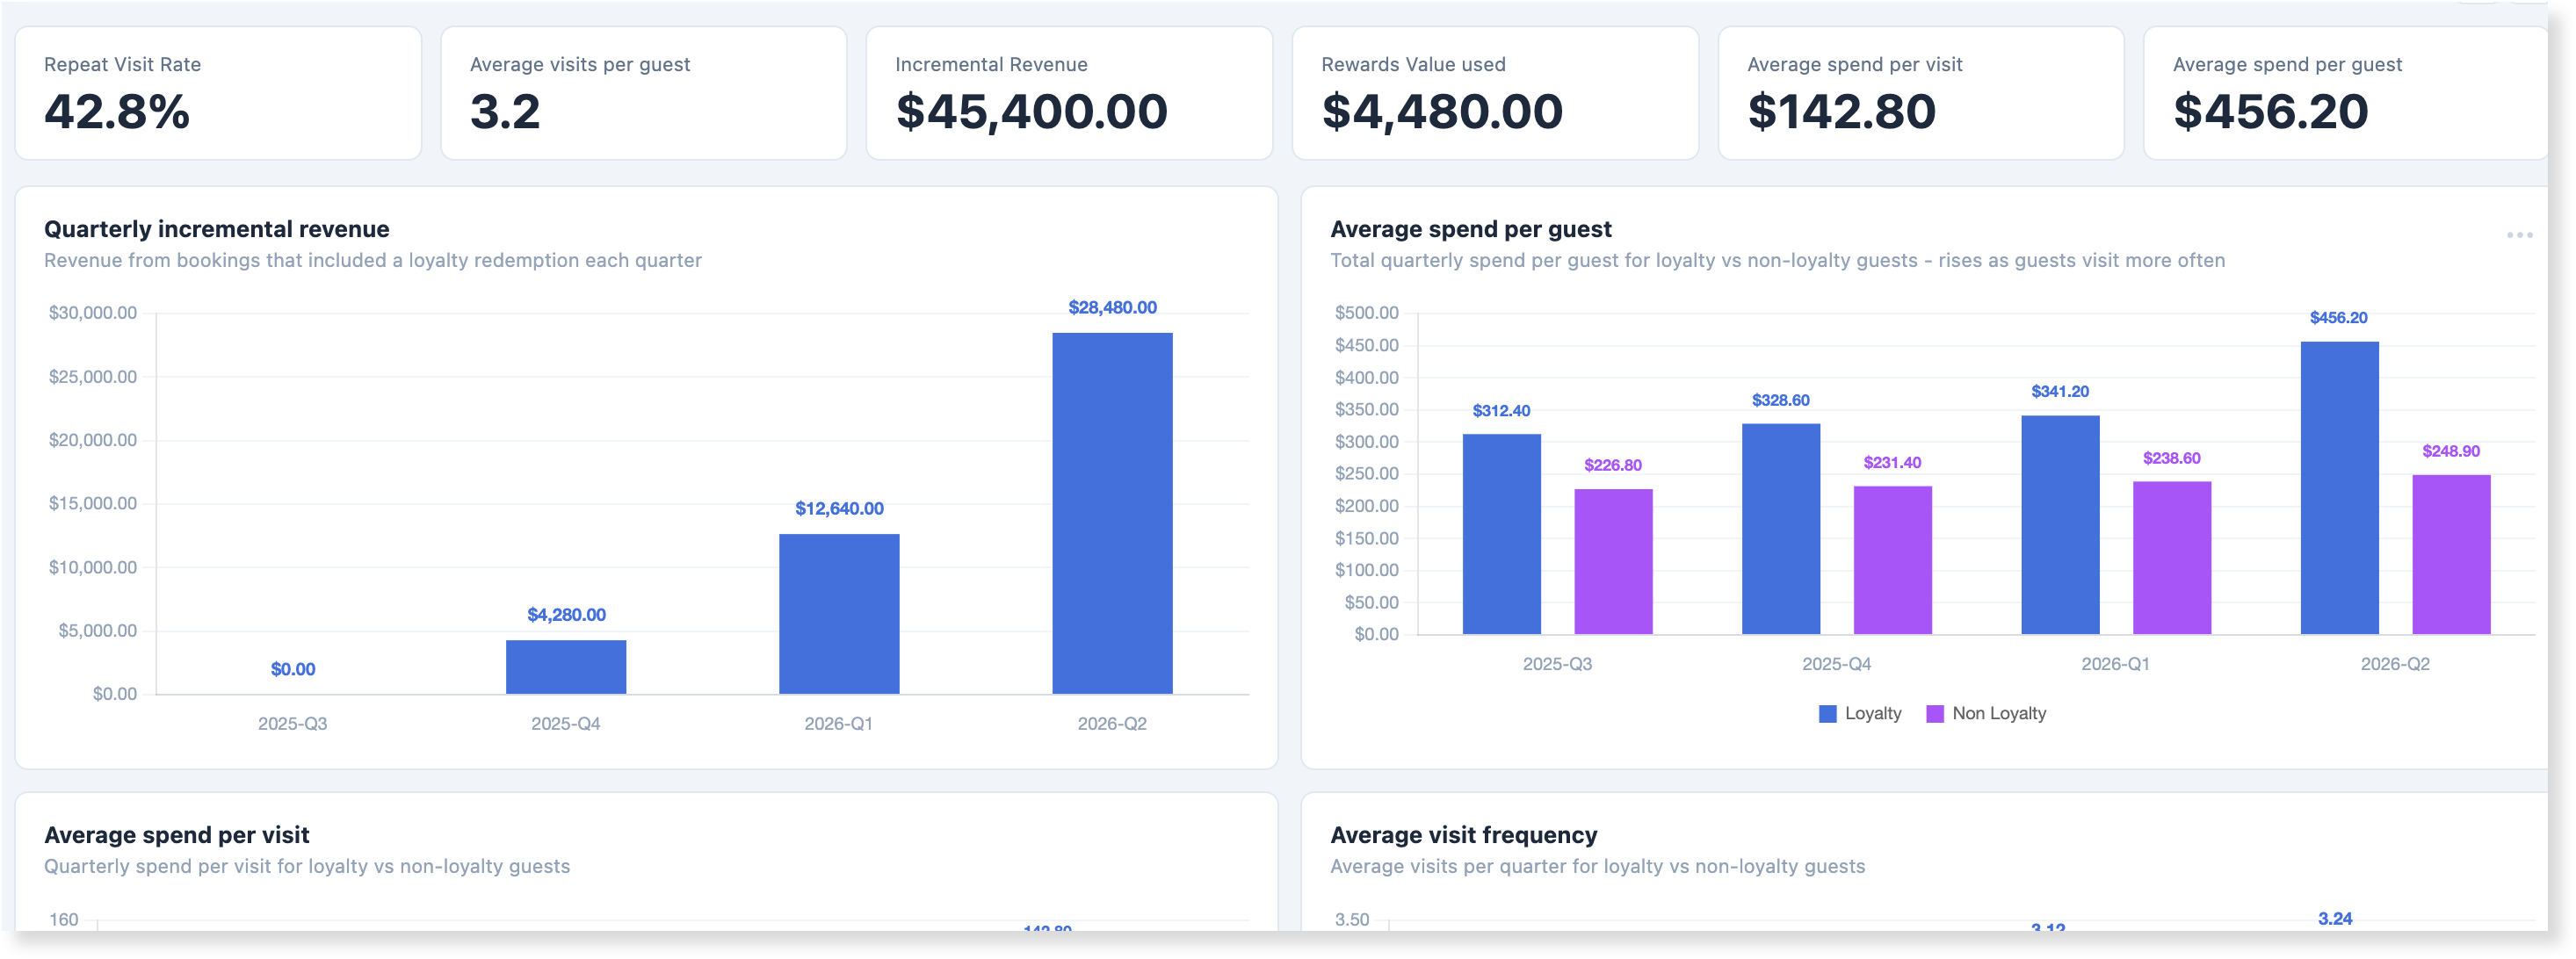
Repeat visit rate | The share of enrolled loyalty guests who visited more than once after joining the program. Calculated as: (Enrolled guests with 2+ visits ÷ total enrolled guests) × 100. Interpret: A high rate means the program is driving return visits. A low rate suggests guests are enrolling but not coming back. Use when: Reviewing overall program health — check this first before digging into spend or redemption data. |
Average visits per guest | The average number of visits an enrolled guest makes in the last 12 months. Calculated as: Unique bookings by enrolled guests ÷ total enrolled guests. Interpret: Use alongside repeat visit rate to understand depth of engagement. A healthy repeat visit rate with a low visit average means most returning guests are only coming back twice. Because this includes all enrolled guests — including those who haven't returned — a low average may reflect inactive enrollees rather than low visit frequency among active guests. Use when: Repeat visit rate isn't giving you enough detail — this shows how often guests are coming back, not just whether they came back. |
Incremental revenue | Revenue from bookings where at least one loyalty point or reward was redeemed, in the last 4 quarters. Calculated as: Sum of booking subtotals (excluding taxes and fees) for bookings where at least one loyalty redemption occurred. Interpret: A growing figure means guests are actively using rewards to book — the behaviour the program is designed to drive. This reflects the gross booking value for reward redemption bookings, not the booking value net of the redemption discount. Pair with rewards value used to understand the ratio of revenue generated against value given away. Use when: You want to understand the total booking value associated with loyalty redemptions, or demonstrate the program's commercial impact to stakeholders. |
Rewards value used | The total discount value applied to bookings through loyalty redemptions in the last 4 quarters. Calculated as: Sum of the dollar value of point redemptions plus the dollar value of reward redemptions applied to bookings. Interpret: This is the cost side of your program — what guests received in discounts through loyalty. A growing figure means guests are finding the program worth engaging with. If it grows faster than incremental revenue, review whether your reward rules and point values are set at the right level. Use when: Evaluating program ROI, reviewing reward rule settings, or reporting on the total cost of the loyalty program to stakeholders. Pair with incremental revenue to understand the ratio of booking value generated against discount value given away. |
Average spend per visit | The average booking value per visit for enrolled loyalty guests over the last 4 quarters. Calculated as: Total booking item cost (local currency) ÷ total unique bookings, across all product types. Interpret: Compare against the quarterly chart to track the spend gap between loyalty and non-loyalty guests over time. A widening gap is a strong signal the program is influencing purchase behaviour. Use when: You want to understand how much guests are spending each time they visit, rather than their total spend overall. Use alongside average spend per guest to distinguish between guests who visit more often and guests who spend more per visit. |
Average spend per guest | The average total spend per unique enrolled loyalty guest over the last 4 quarters. Calculated as: Total booking item cost (local currency) ÷ unique enrolled guests who visited, across all product types. Interpret: Compare against the quarterly chart to track how this changes over time. A higher average spend per guest for loyalty guests vs non-loyalty guests suggests the program is influencing overall spending behaviour. Use alongside average spend per visit to distinguish between guests who visit more often and guests who spend more per visit — both contribute to overall guest value differently. Use when: You want a total revenue-per-guest view rather than a per-visit view. Useful for comparing loyalty vs non-loyalty guest value or reviewing program performance over time. |
Quarterly charts
The quarterly charts track your program's impact over time.
Three charts — average spend per guest, average spend per visit and average visit frequency — compare loyalty vs non-loyalty guests.
If loyalty guests are spending more and visiting more often than non-loyalty guests, that's a positive signal — though the comparison becomes more meaningful as your program matures.
Two charts — quarterly incremental revenue and quarterly redemption value used — show whether your revenue and redemption totals are increasing each quarter.
These charts are most useful once your program has been running for at least one to two quarters and you have enough enrolled guests to form a meaningful comparison. In the early stages, most loyalty cohort data reflects guest behaviour before the program launched. When reviewing quarter on quarter trends, keep seasonality in mind — a dip or spike may reflect the time of year rather than program performance.
Chart | What it shows |
|---|---|
Quarterly incremental revenue | Revenue from bookings where at least one loyalty point or reward was redeemed, each quarter. What to look for: A growing total quarter on quarter means more guests are using rewards to book. Quarters with no bar indicate redemptions had not yet started — this is expected in the early stages of a new program. |
Average spend per guest | Total spend per guest each quarter — loyalty vs non-loyalty guests. What to look for: Loyalty guests spending more per guest than non-loyalty guests is a sign the program is working. Average spend per guest rises as guests visit more often, so a growing gap over time is a strong positive signal. |
Average spend per visit | Spend per visit each quarter — loyalty vs non-loyalty guests. What to look for: In the early quarters of a new program, non-loyalty guests may spend more per visit — this is expected as the loyalty cohort data in early quarters reflects guest behaviour before the program launched. Look for loyalty guests to close the gap as redemptions increase. |
Average visit frequency | Average visits per quarter — loyalty vs non-loyalty guests. What to look for: Loyalty guests visiting more often than non-loyalty guests is a strong signal the program is driving repeat visits. If the gap is narrowing, review whether guests have enough incentive to return. |
Quarterly redemption value used | Total value of rewards redeemed each quarter, broken down by points redemption and rewards redemption. What to look for: A growing total means guests are actively using rewards — a sign of healthy program engagement. Review the breakdown between points and rewards to understand which is driving activity. Pair with quarterly incremental revenue to track redemption cost against booking revenue. |
Loyalty program engagement dashboard
This dashboard shows how actively guests are participating in your program, from signing up to earning and redeeming rewards.
Low enrollment means guests aren't joining. Low redemption means guests aren't finding enough value to use what they've earned. Use this dashboard to identify which part of the journey needs attention.
Top 3 insights
Start with enrollment rate. If it's low, not enough guests are joining and the program can't build momentum regardless of how good the rewards are.
Check guest redemption rate. This reveals whether enrolled guests find the program valuable enough to act on — a low rate means guests are earning but not redeeming.
Use the monthly charts to find where guests are dropping off. Compare enrollment rate, invite acceptance rate and redemption rate together to identify the specific point in the journey that needs attention.
Top-level metrics
Metric | Definition |
|---|---|
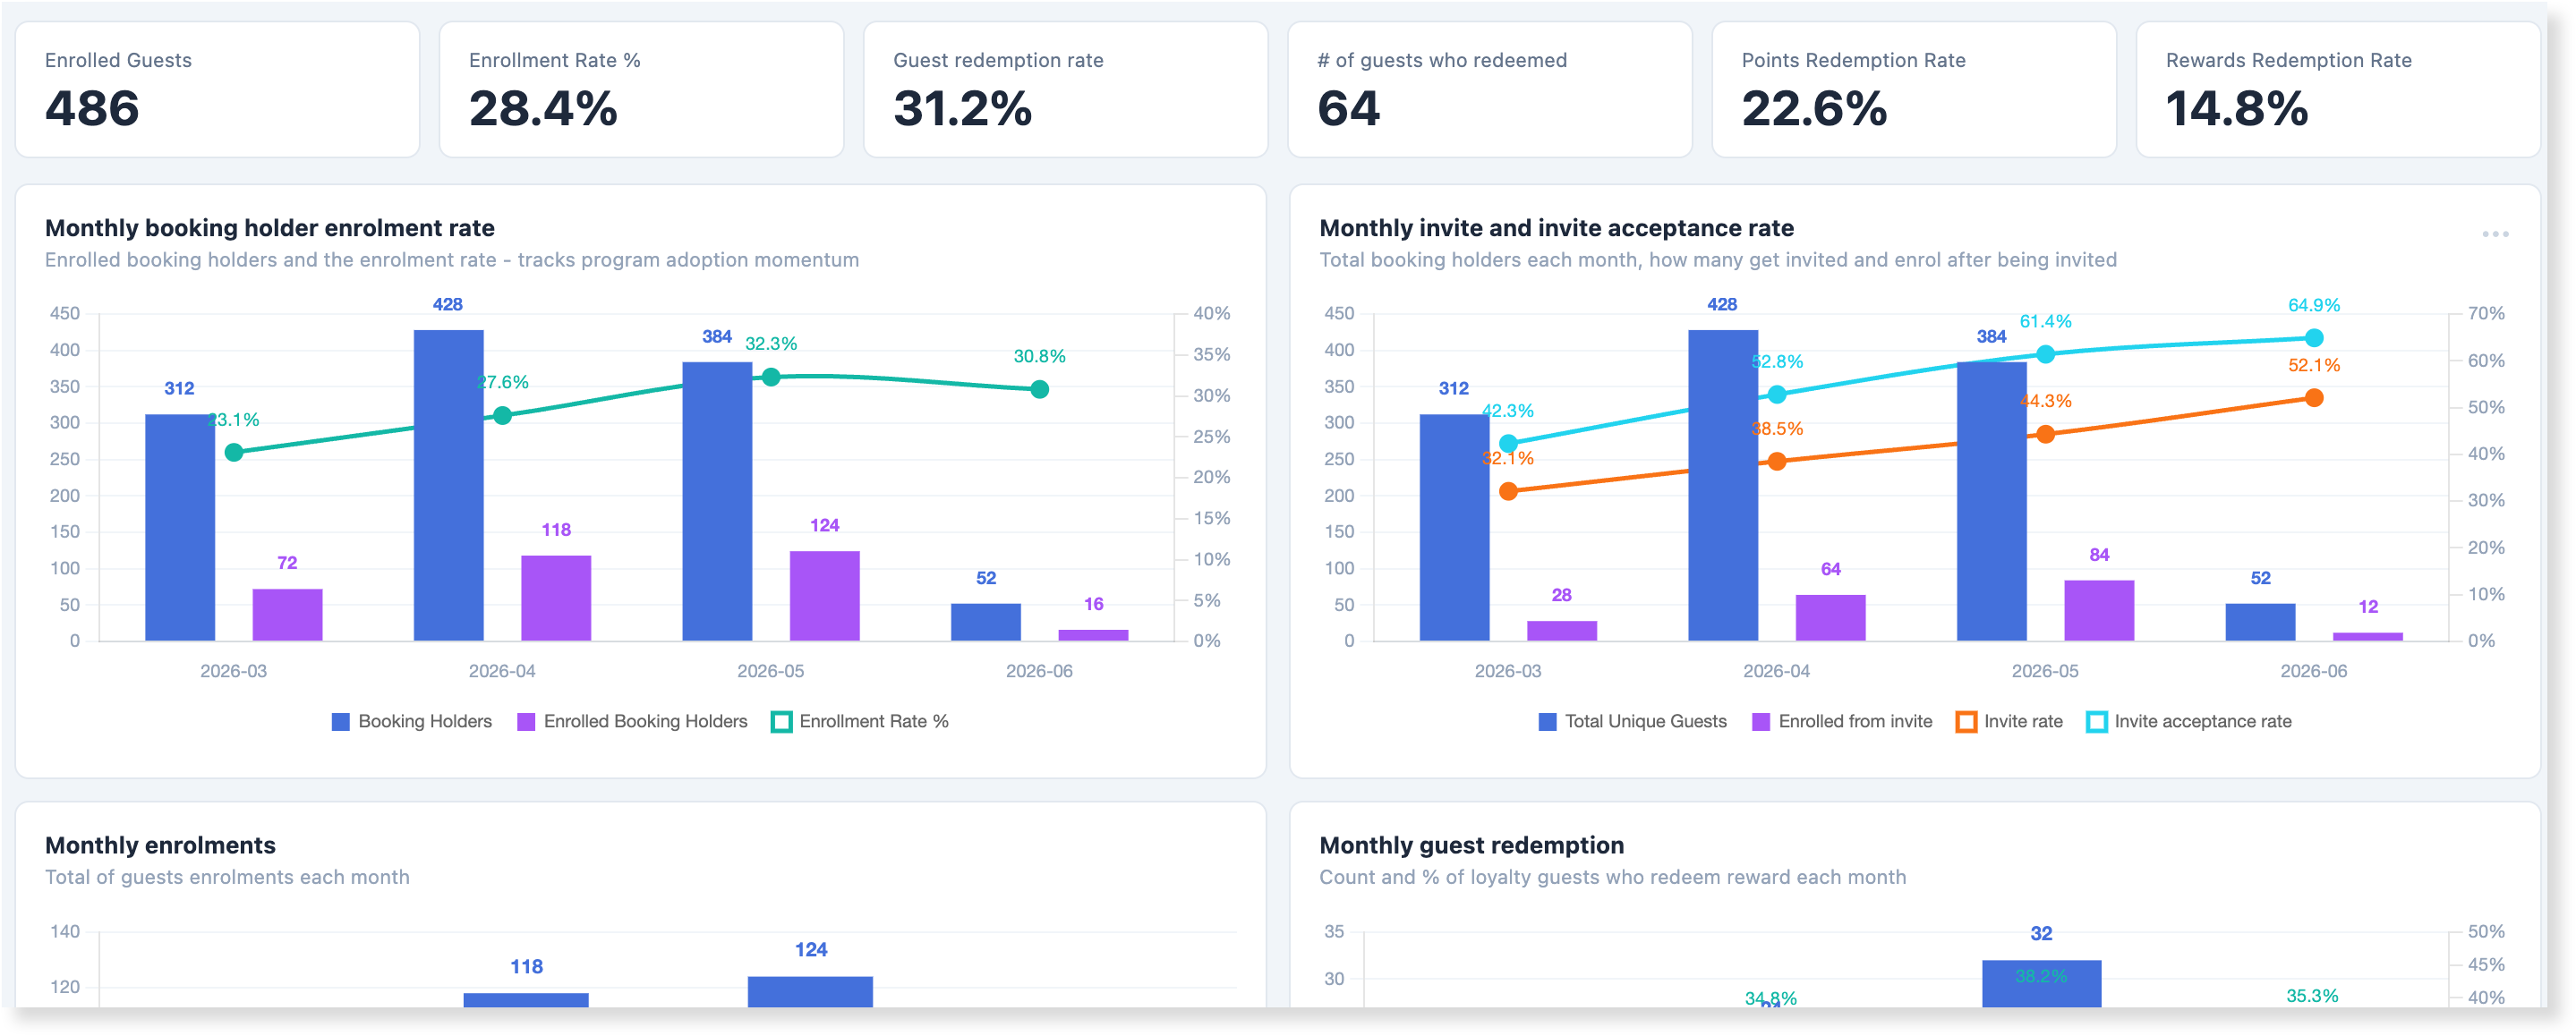
Enrolled guests | Total guests who have enrolled in your loyalty program since it launched, regardless of whether they have visited or redeemed since joining. Calculated as: Count of unique guests who accepted an invitation to join or completed self-enrollment. Interpret: Use this as your baseline measure of program reach. A growing number shows the program is attracting guests. Use alongside enrollment rate to understand whether growth is keeping pace with your booking volume. Use when: Getting a snapshot of total program reach or tracking overall enrollment growth over time. |
Enrollment rate (%) | The share of booking holders who enrolled in the loyalty program, measured from the date the program was activated at your venue. Calculated as: Enrolled booking holders ÷ (booking holders with a guest ID + booking holders without a guest ID). The denominator captures all booking holders — whether or not a guest ID was recorded at the time of booking. Interpret: Shows how widely the program is being adopted across your guest base. A low rate suggests guests are booking but not joining — check whether enrollment is being offered at every booking touchpoint. Use when: Assessing overall program adoption or identifying whether enrollment prompts are reaching enough guests. |
Guest redemption rate (%) | The percentage of active loyalty guests who redeemed points or a reward at least once in the last 4 quarters. Calculated as: Guests with at least one redemption (points or reward) ÷ active loyalty accounts (guests with at least one earn or redeem event). Interpret: Shows how many engaged loyalty guests are getting enough value from the program to redeem. A low rate means guests are earning but not redeeming — review whether your reward thresholds are set too high or whether guests know what they can redeem. Use when: Diagnosing whether the program is delivering enough perceived value to drive redemption behaviour among guests who are actively participating. |
Points redemption rate (%) | The percentage of all points earned that have been redeemed since the program launched. Calculated as: Total points redeemed ÷ total points earned, for enrolled guests. Interpret: A higher rate signals guests find the program valuable enough to use their points. A low rate suggests guests are earning but not redeeming — check whether reward thresholds are set too high or whether guests are aware they can redeem. Use alongside guest redemption rate to distinguish between guests who aren't redeeming at all vs guests redeeming at a low volume. Use when: Understanding whether earned points are being activated, or diagnosing whether your points-to-reward structure is working. |
Rewards redemption rate (%) | The percentage of all rewards earned that have been redeemed since the program launched. Calculated as: Total rewards redeemed ÷ total rewards earned, for enrolled guests. Interpret: A higher rate signals guests find their earned rewards valuable enough to use. A low rate suggests guests are earning rewards but not redeeming them — check whether reward types are appealing, whether guests know how to redeem, or whether the redemption process has friction. Use alongside points redemption rate to understand whether guests engage differently with rewards vs points. Use when: Understanding whether earned rewards are being activated, or identifying whether specific reward types need reviewing. |
Monthly charts
Use the monthly charts to track whether guest participation is growing and where it might be stalling.
Chart | What it shows |
|---|---|
Monthly booking holder enrollment rate | Total booking holders and enrolled booking holders each month, with the enrollment rate as a percentage. What to look for: A rising enrollment rate month on month shows the program is reaching more guests. If total booking holders are growing but the enrollment rate is flat or falling, more guests are booking without joining — check whether enrollment is being offered consistently at every booking touchpoint. |
Monthly invite and invite acceptance rate | Total booking holders each month, how many were invited to join loyalty and how many enrolled after being invited — shown as counts and rates. What to look for: Track invite rate and acceptance rate separately. A low invite rate means not enough guests are being offered the program. A low acceptance rate means invited guests aren't converting — review the invitation messaging or timing. |
Monthly enrollments | Total new guest enrollments each month. What to look for: A growing monthly total shows enrollment momentum is building. A dip may reflect seasonal changes in booking volume rather than a program issue — check alongside booking holder enrollment rate for context. |
Monthly guest redemption | The number of loyalty guests who redeemed points or rewards each month, with the guest redemption rate as a percentage. What to look for: Track the count and rate together. A rising count with a falling rate is expected as your enrolled guest base grows — more guests are redeeming in absolute terms, but the share redeeming may dip as new enrollees haven't yet had the opportunity to redeem. |
Monthly points earned and redeemed | Total points earned and redeemed by enrolled guests each month. What to look for: A growing points earned total shows guests are actively booking and accumulating points. If points redeemed is growing more slowly than points earned, guests may not be aware they can redeem or reward thresholds may be set too high. |
Monthly rewards earned and redeemed | Total rewards earned and redeemed by enrolled guests each month. What to look for: In the early stages of a new program, earned and redeemed reward numbers will be low — this is expected. Look for rewards earned to grow as guests reach reward thresholds, followed by redemptions increasing as guests start using them. |