ROLLER iQ is your AI-powered assistant, built specifically for the attractions industry. It transforms your venue’s data into instant insights and recommendations you can act on right away — no analysts, no buried reports.
Learn what it can do for you and how to get the best results.
Register your venue for early access
Be among the first to experience ROLLER iQ. Access will roll out in phases, join the waitlist today.
How to access ROLLER iQ
You can access ROLLER iQ in these ways:
Venue Manager (Mobile): Log in to Venue Manager on your phone to open ROLLER iQ by default. To access the full Venue Manager, tap the menu (☰) in the top-left corner, then select Visit Venue Manager.
Venue Manager (Desktop): Select Intelligence > ROLLER iQ in the left-hand menu.
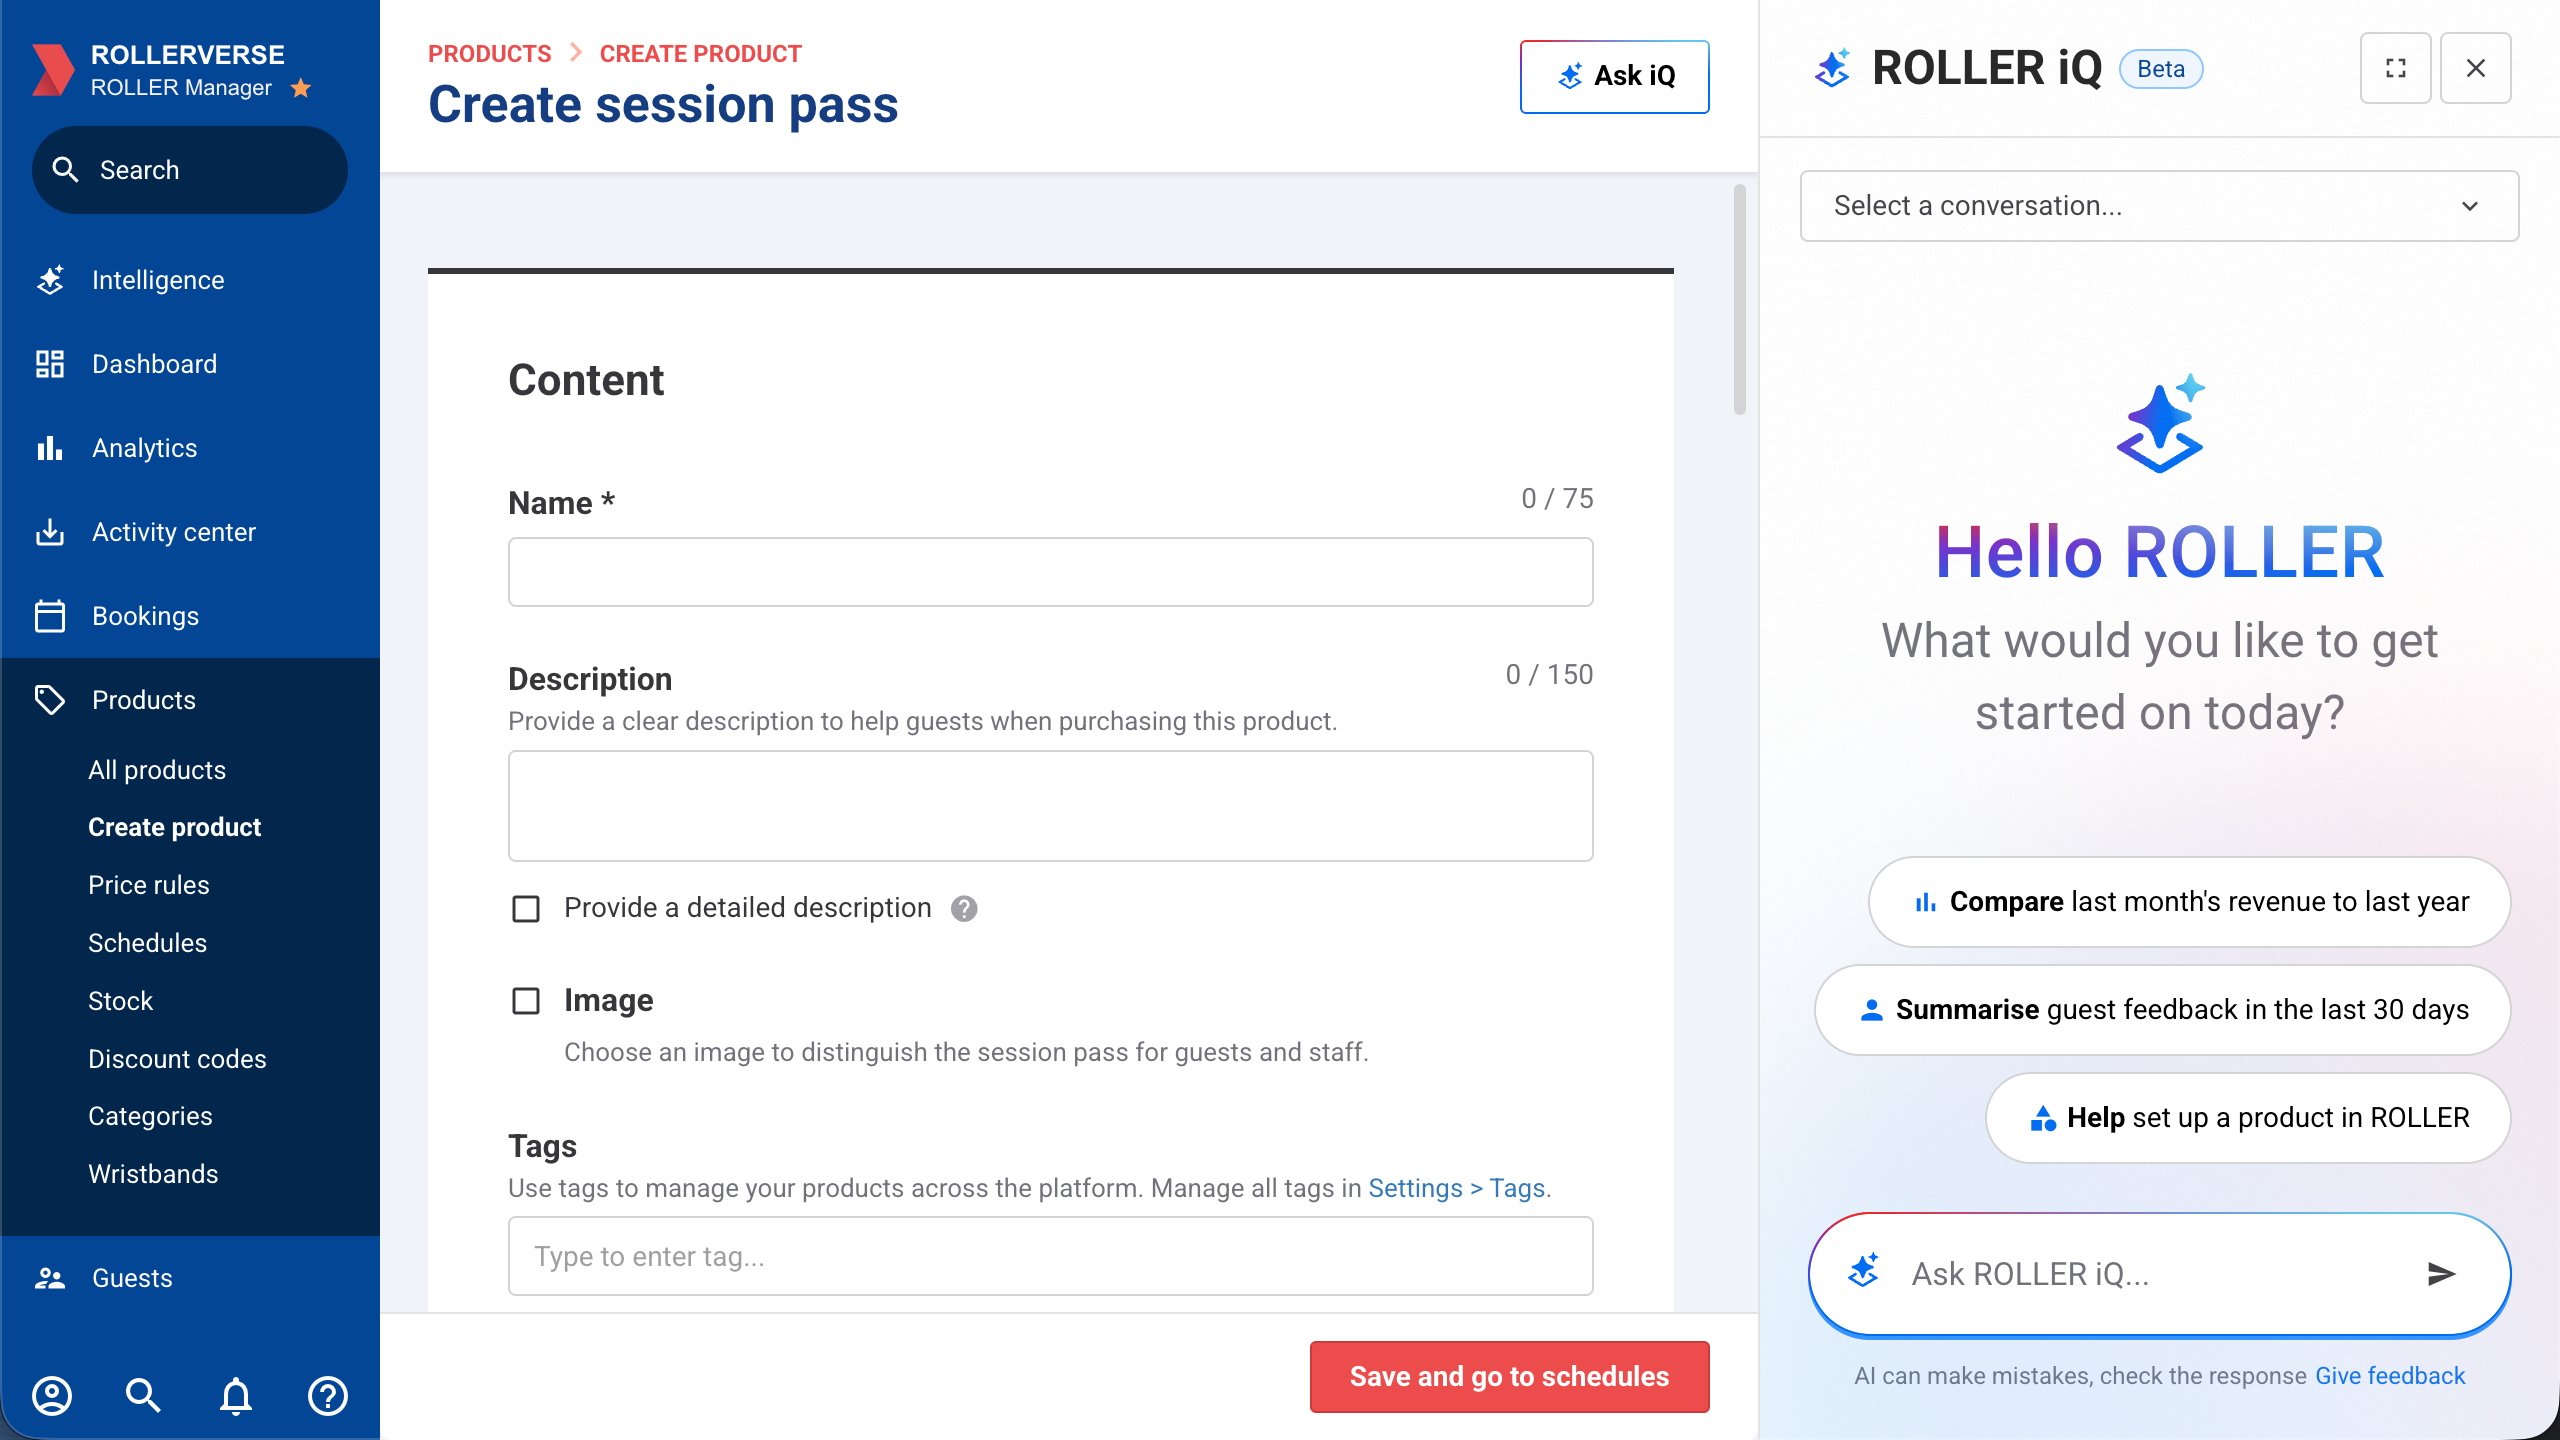
Sidebar: Roller iQ is available on most pages in Venue Manager. Select the Ask iQ button at the top of the page to start a sidebar conversation.
Access permissions
ROLLER iQ is enabled by default for the Administrator and Manager system roles and any custom roles based on them. Administrators can manage the Can use ROLLER iQ permission for any custom role in role permissions settings.
Staff members with the Can use ROLLER iQ permission can see all data available in iQ. This may include data that is not visible to them elsewhere in Venue Manager.
What you can do in ROLLER iQ
ROLLER iQ can answer a wide range of questions about your venue. This guide focuses on high-impact examples that support you managing operations.
Customize your ROLLER iQ mobile dashboard
On mobile, you can customize your iQ dashboard and see at a glance how your venue’s tracking week on week. Every operator's priorities are different, which is why you can customize your mobile iQ dashboard by selecting the metrics that matter most to you, so your daily view is always relevant to how you run your venue.
To customize your dashboard, follow the steps below:
Log into Venue Manager on your mobile phone to land on the ROLLER iQ dashboard.
Select Edit dashboard.
To add or remove metrics from your dashboard, select + or - next to the metric you want to add or remove.
To re-arrange the display order of your metrics, drag and drop each metric into place.
Select Done.
From your dashboard, select any metric to instantly launch an iQ conversation that digs deeper into the numbers, turning metrics into actionable insights. It's a fast and convenient way to stay across your venue's performance each day and discover what iQ can do for you.
Compare your venue to industry benchmarks
ROLLER iQ can compare your venue’s performance against attractions industry benchmark data, helping you understand how you’re tracking against broader industry trends.
ROLLER iQ will analyze your venue’s data and compare it with industry benchmarks to highlight where you are performing strongly and where there may be opportunities to improve.
These benchmarks are based on insights from the Attractions Industry Benchmark Report and allow you to quickly see how your venue compares in key areas.
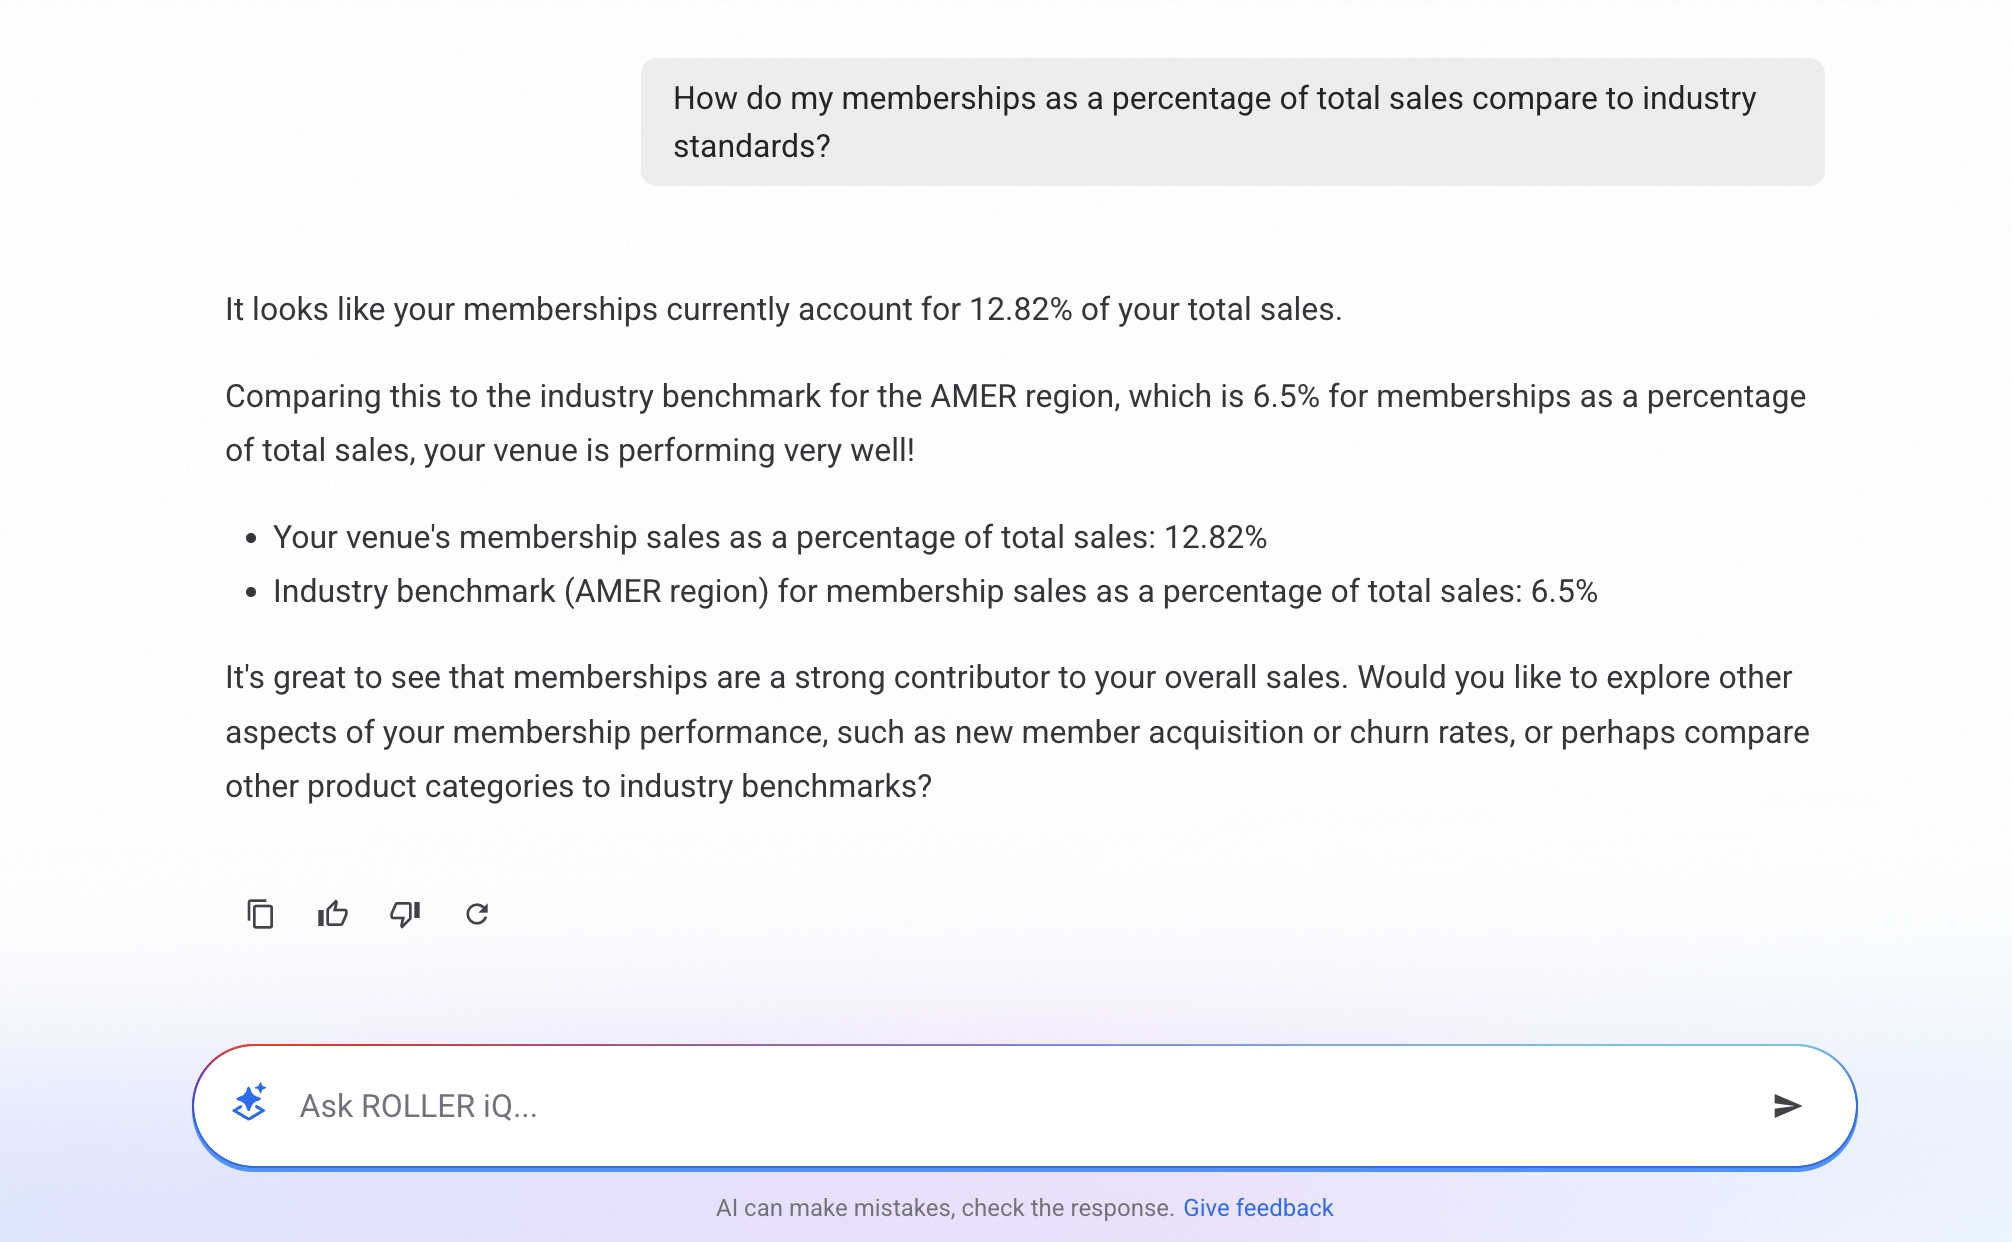
Membership contribution to sales
Ask:
How do my memberships as a percentage of total sales compare to industry standards?
Why it matters:
Members visit 4.9 times per year, compared to 1.3 times for non-members. Tracking this percentage helps you see how well you’re converting casual visitors into repeat guests and building steady revenue.
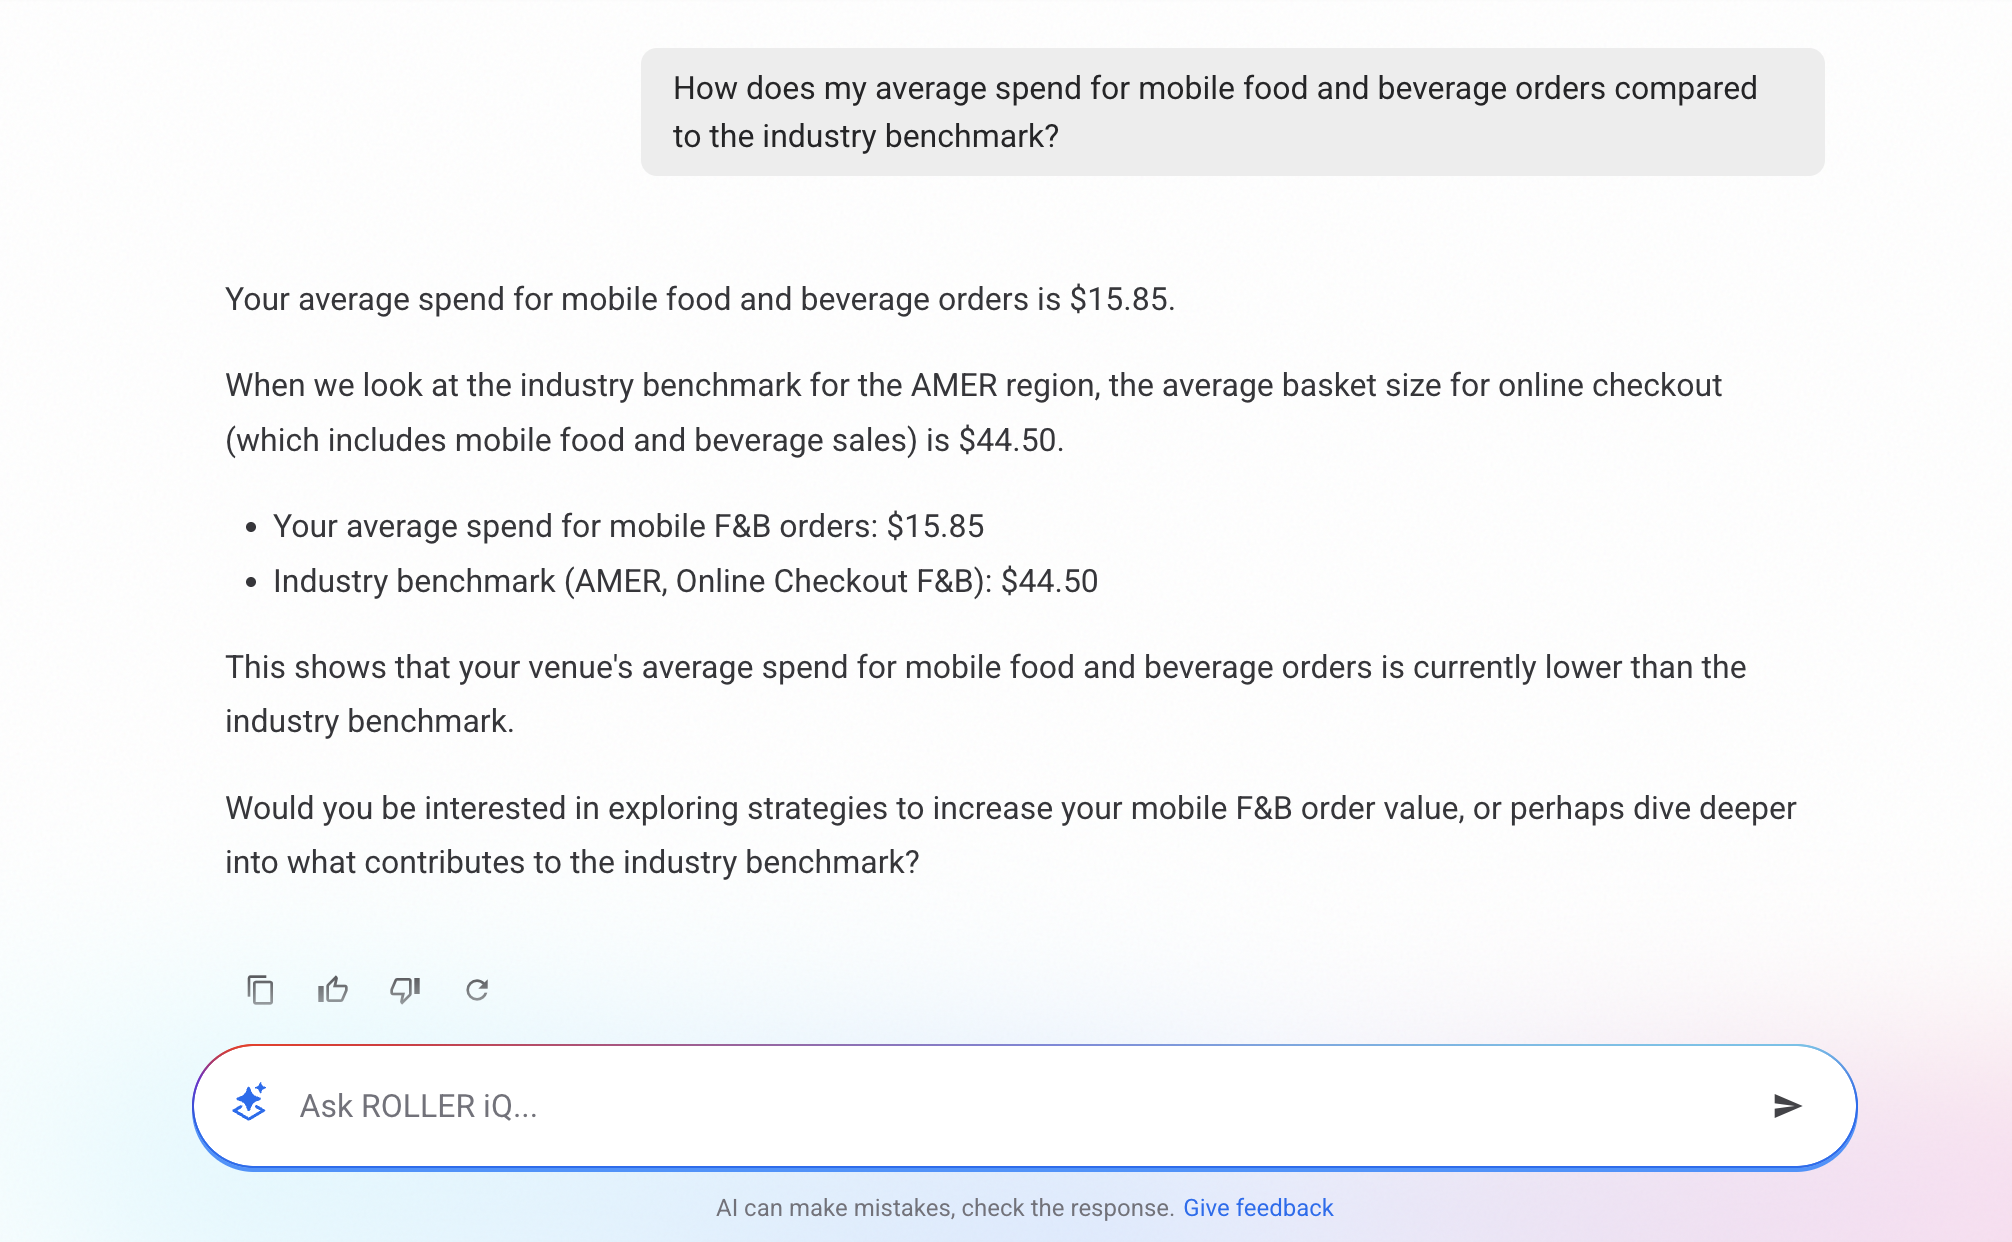
Mobile food and beverage spending
Ask:
How does my average spend for mobile food and beverage orders compare to the industry benchmark?
Why it matters:
The benchmark report shows guests spend 3.3× more when ordering F&B on mobile ($29.30) than at the POS ($9.00). Knowing your numbers will show you how much revenue you’re gaining by (or losing by not) promoting mobile ordering. It’s the single best way to increase F&B sales without hiring more staff.
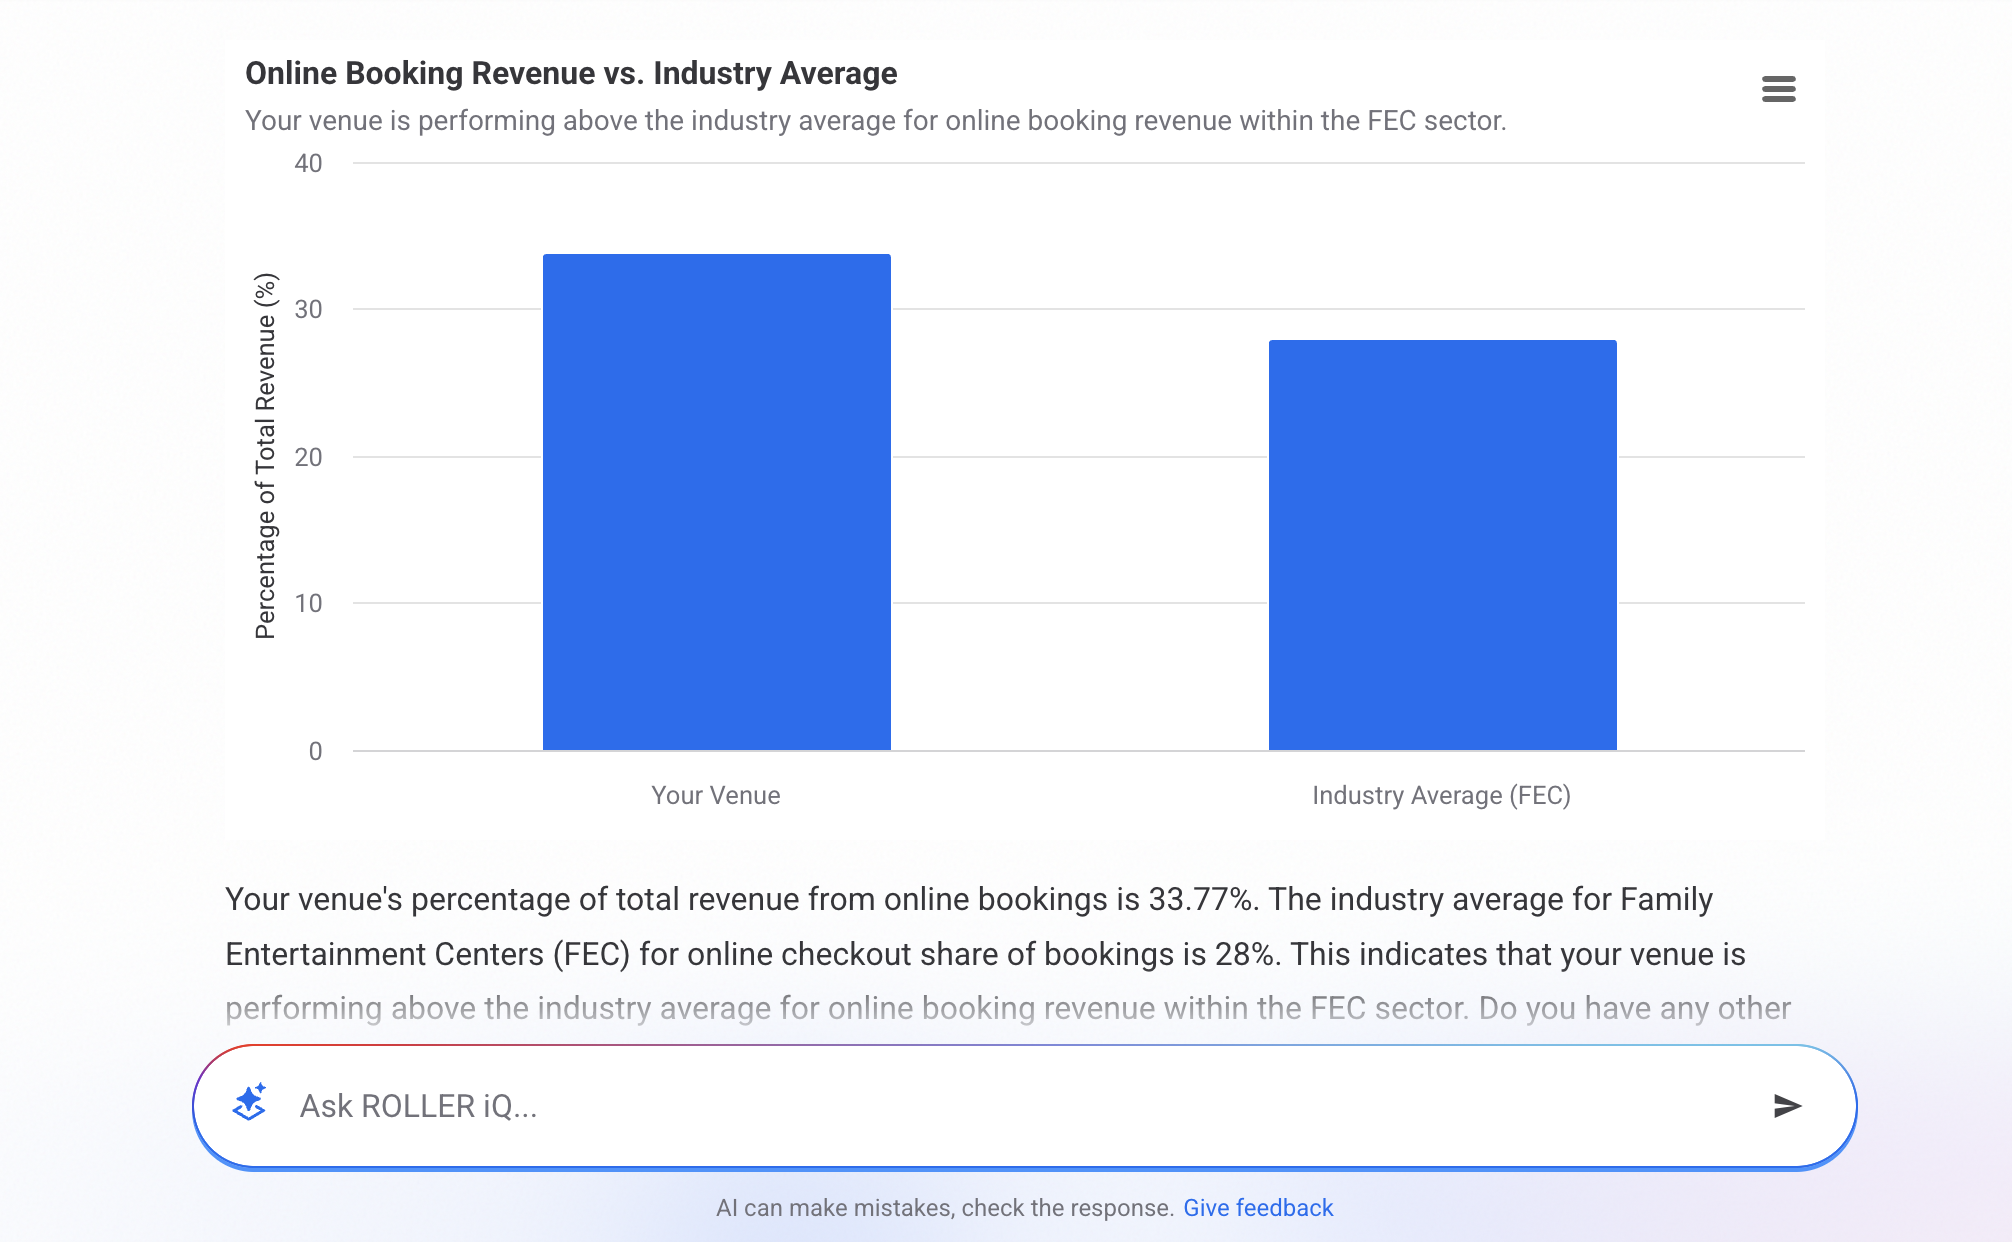
Online revenue performance
Ask:
How does my percentage of total revenue coming from online bookings compare to the industry average?
Why it matters:
The industry benchmark shows that 45% of total revenue comes from online checkouts. If your percentage is lower, you might be missing out on the higher average transaction values that come with digital bookings (typically 3.4× larger than POS transactions).
Guest loyalty
Ask:
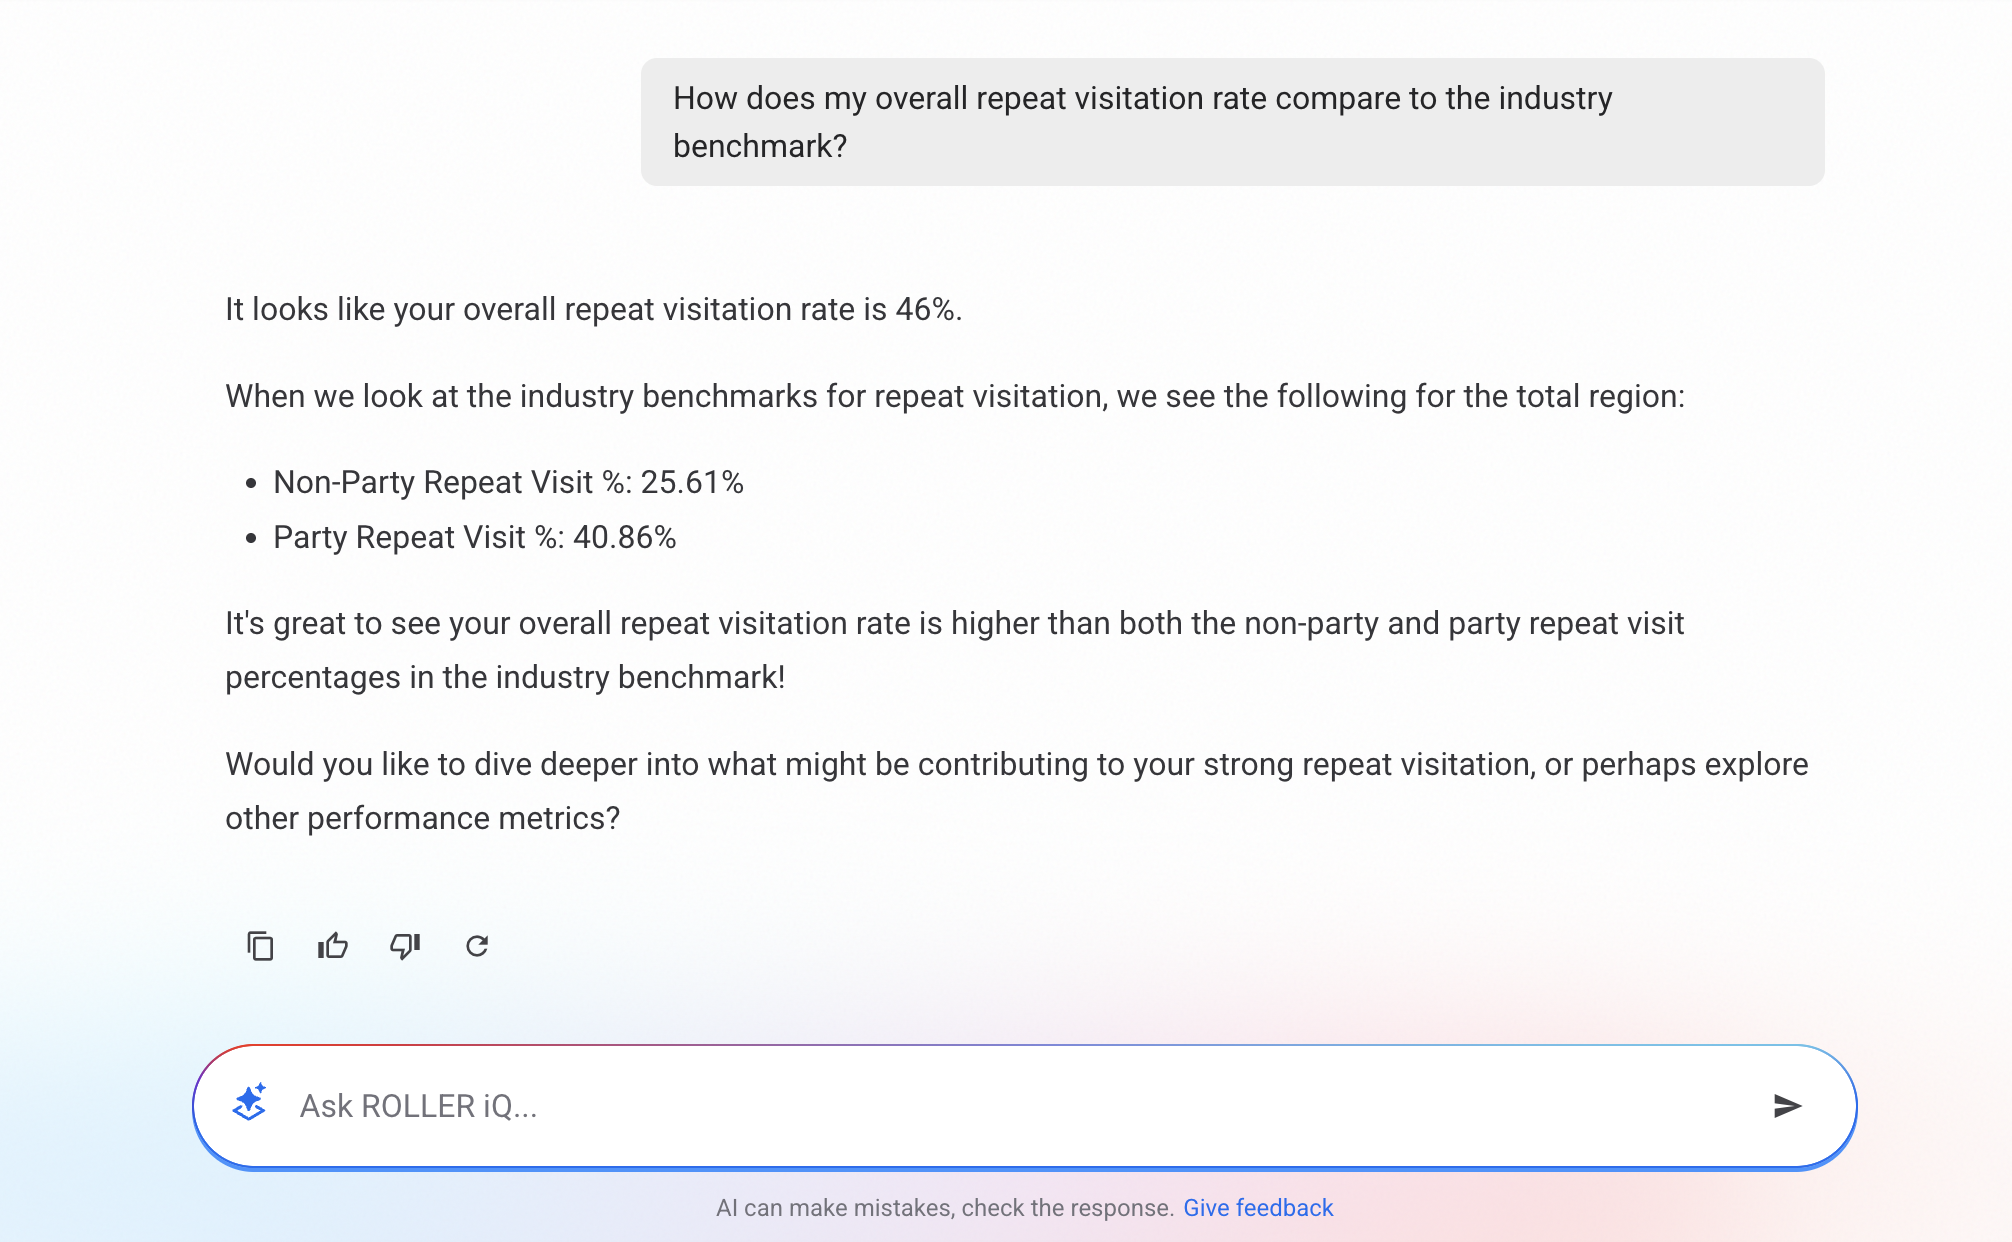
How does my overall repeat visitation rate compare to the industry benchmark?
Why it matters:
The 2026 report splits benchmarks into two groups: venues that offer parties (40.8% repeat rate) and those that don’t (25.6%). Ask this question to see where you land. If you offer parties but your rate is closer to the “Non-Party” benchmark, it’s a clear signal to focus on post-party marketing to turn one-time celebrants into regulars.
Guest experience score
Ask:
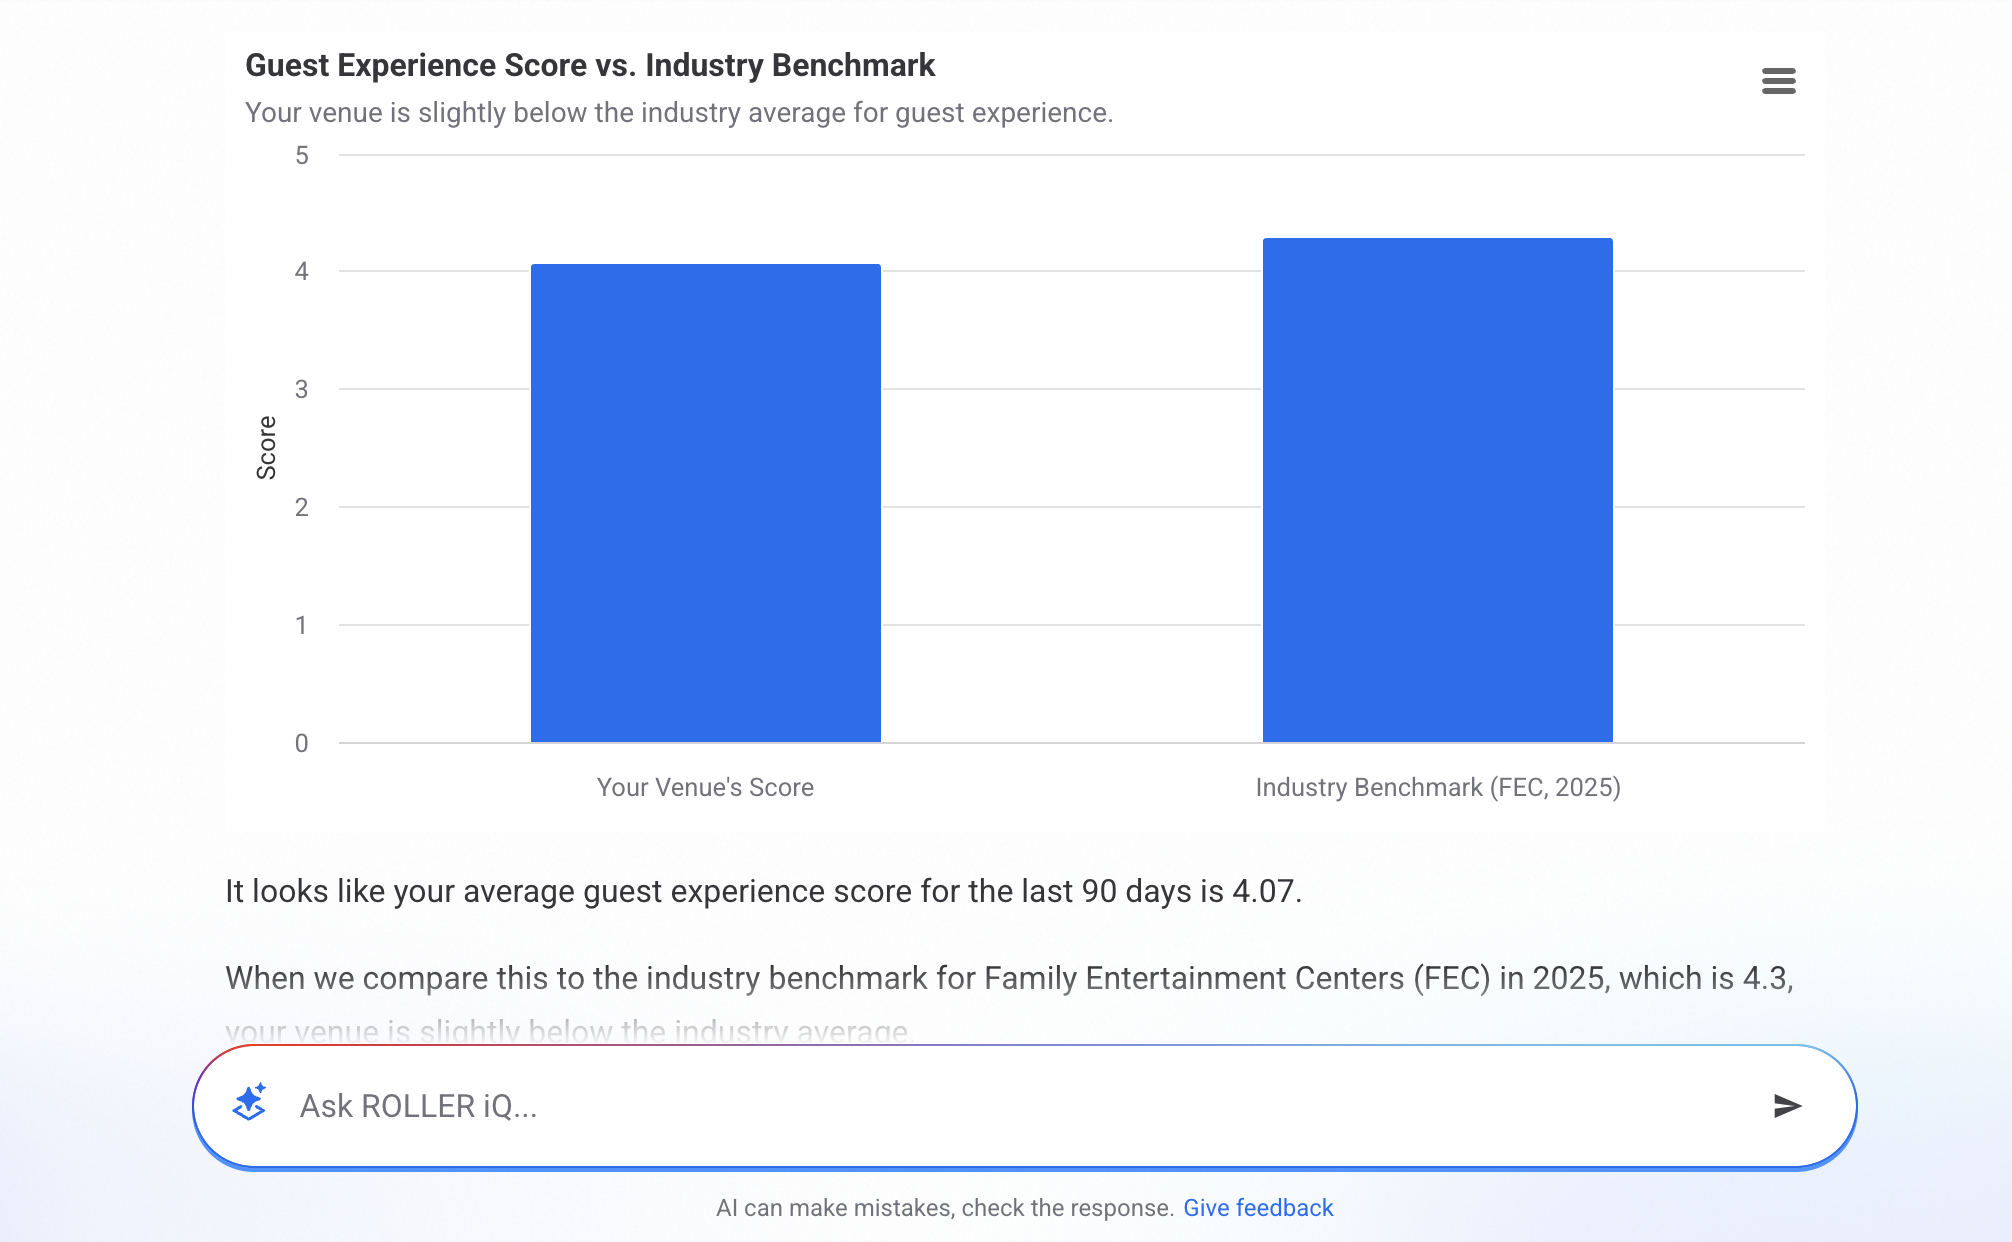
How does my average guest experience score compare to the industry benchmark?
Why it matters:
The global average Guest Experience Score rose to 4.29 out of 5 in 2025. This score is your direct line to guest sentiment regarding service, value, and facilities. If your score is tracking below this benchmark, dig into your specific survey feedback to identify quick wins for improvement.
Use Deep Insights to discover your next steps
Deep Insights helps you go beyond understanding what is happening in your venue’s data by highlighting opportunities and suggesting actions you can take to improve performance.
When you ask a performance-focused question, ROLLER iQ analyzes your venue’s data and context to generate insights and recommended next steps.
Deep Insights can help with questions such as:
How can I increase revenue this month?
What products are underperforming?
What are my best upsell opportunities?
What should I focus on to increase bookings during slower periods?
Instead of only returning data, Deep Insights interprets what the data means and suggests practical actions based on your venue’s historical performance and operational patterns.
For example, ROLLER iQ may identify:
products that generate most of your revenue
booking patterns across different times or days
opportunities to adjust pricing or promotions
operational changes that could increase bookings
These insights help venue managers quickly identify where to focus their efforts and make more informed decisions without needing to analyze multiple reports.
Compare trends over time
Use ROLLER iQ to explore how key metrics are tracking over time. Compare revenue, bookings or guest behavior to spot changes and support informed decisions.
ROLLER iQ is great for conversations. After you get an initial answer, ask a follow-up question like "Why did that happen?" or "Break that down by sales channel" to uncover deeper insights.
Check your month-to-date performance
It’s mid-month and you need a quick snapshot of how revenue is tracking for a management update.
Start by asking:
What's our revenue so far this month?
Then, ask to see a comparison to the same time last month:
Can you show me a month to date comparison?
Plan for the week ahead
It's Wednesday and you're planning your staff roster for the upcoming weekend. You can use ROLLER iQ to get a quick forecast of how busy you'll be.
Start by asking:
How many bookings do we have for this Saturday?
Then, add context to see how you're tracking:
How does that compare to last Saturday?
Understand your guest mix
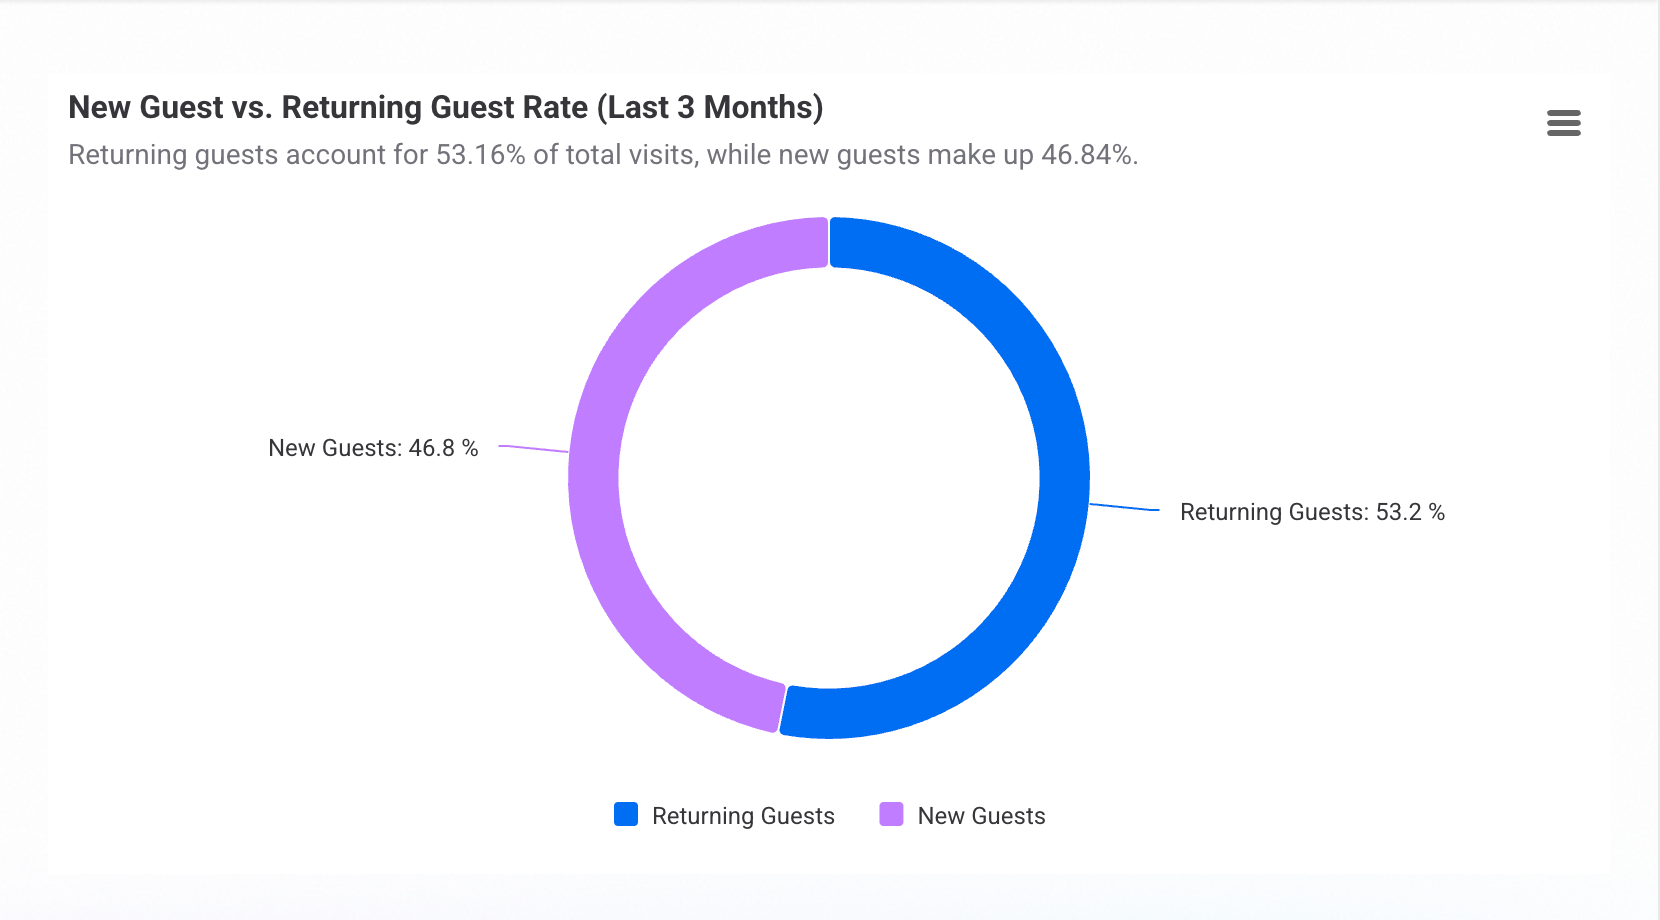
You want to know if your recent campaigns are bringing in new visitors or just engaging your existing guest base.
Start by asking for the ratio:
What is our new guest vs returning guest rate for the last 3 months?
Then, see how that's changed over time:
How does this compare to the same period last year?
Assess the health of your membership program
You're preparing for a team meeting and need a quick update on how your membership program is tracking.
Start by asking for a top-level summary:
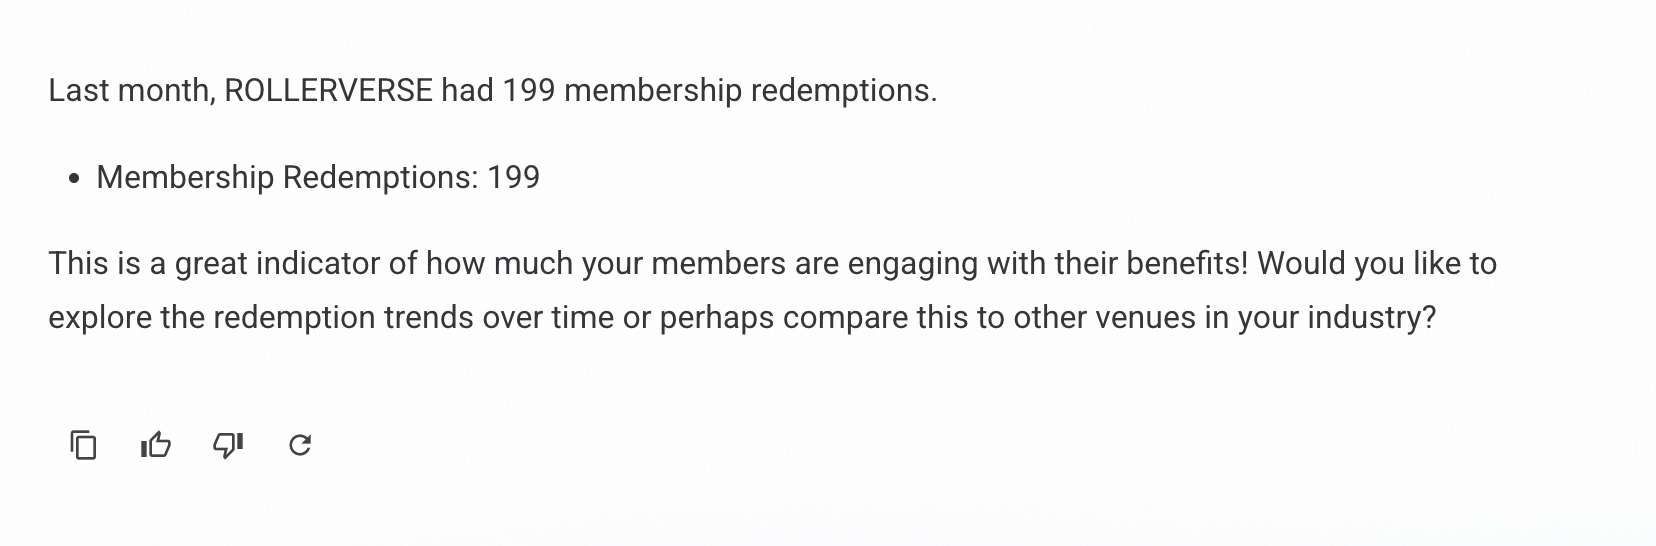
Can you give me a summary of our membership performance last month?
Then follow up with:
How many membership redemptions did we have last month
Analyze venue performance
Use ROLLER iQ to understand what’s happening across your venue. Dig into specific products, booking patterns or performance drivers to uncover what’s working and where to focus next.
Be as specific as you can with dates and times. Instead of asking about "the last few days," try "the last 3 days" for a more precise answer.
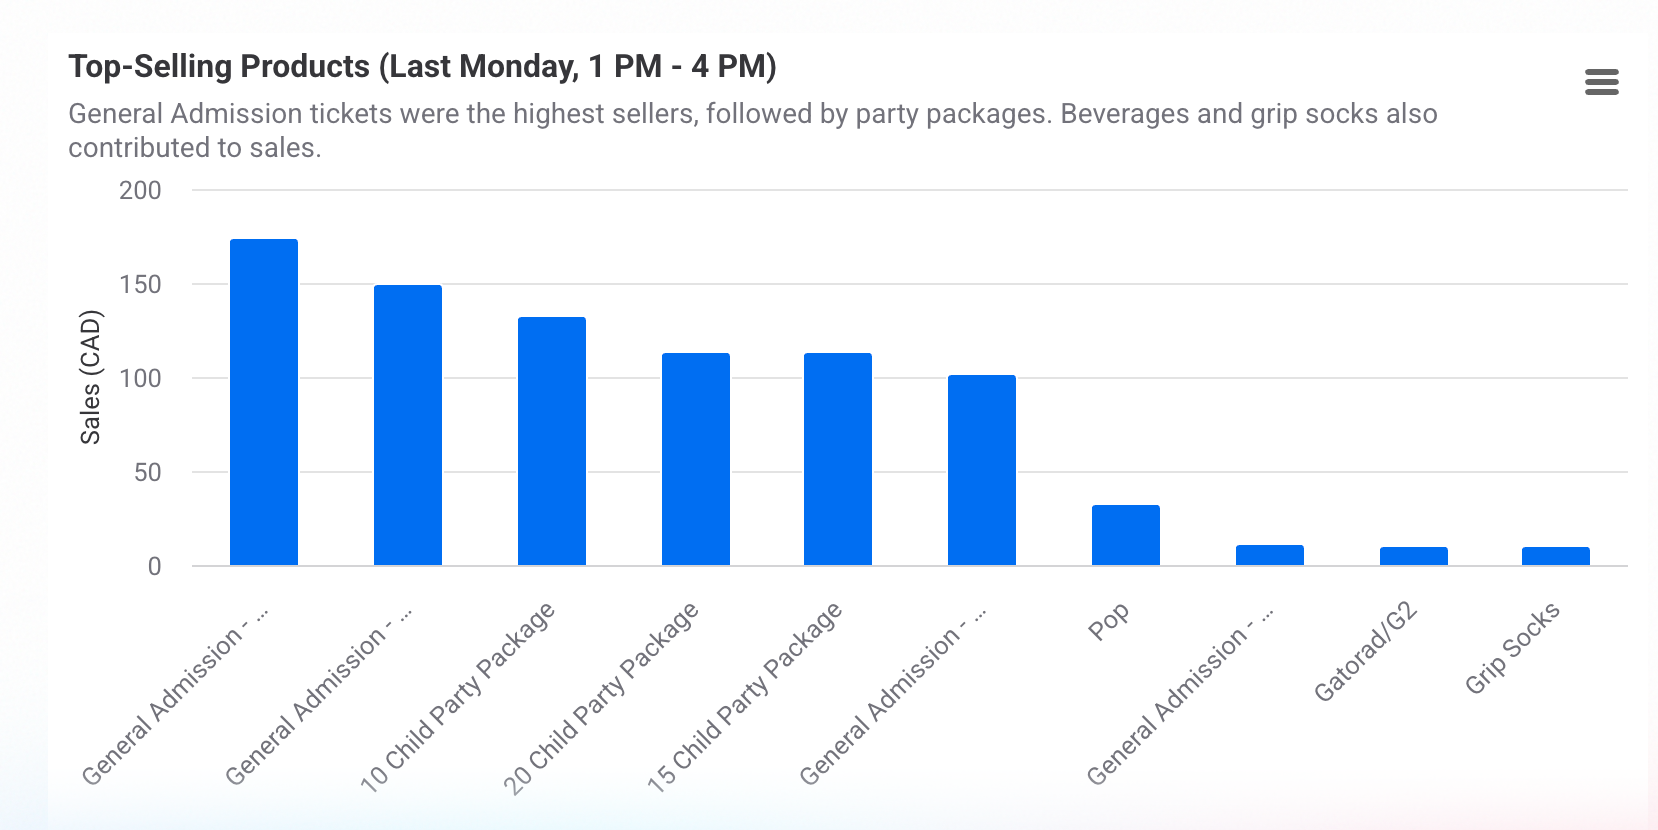
Investigate a specific time period
You ran a promotion on Monday afternoon and want to see if it had an immediate impact on sales.
Start by asking a specific question:
What was our revenue last monday from 1 to 4pm
Then, ask for an insight:
What were the top-selling products during that time?
Review your top-selling products
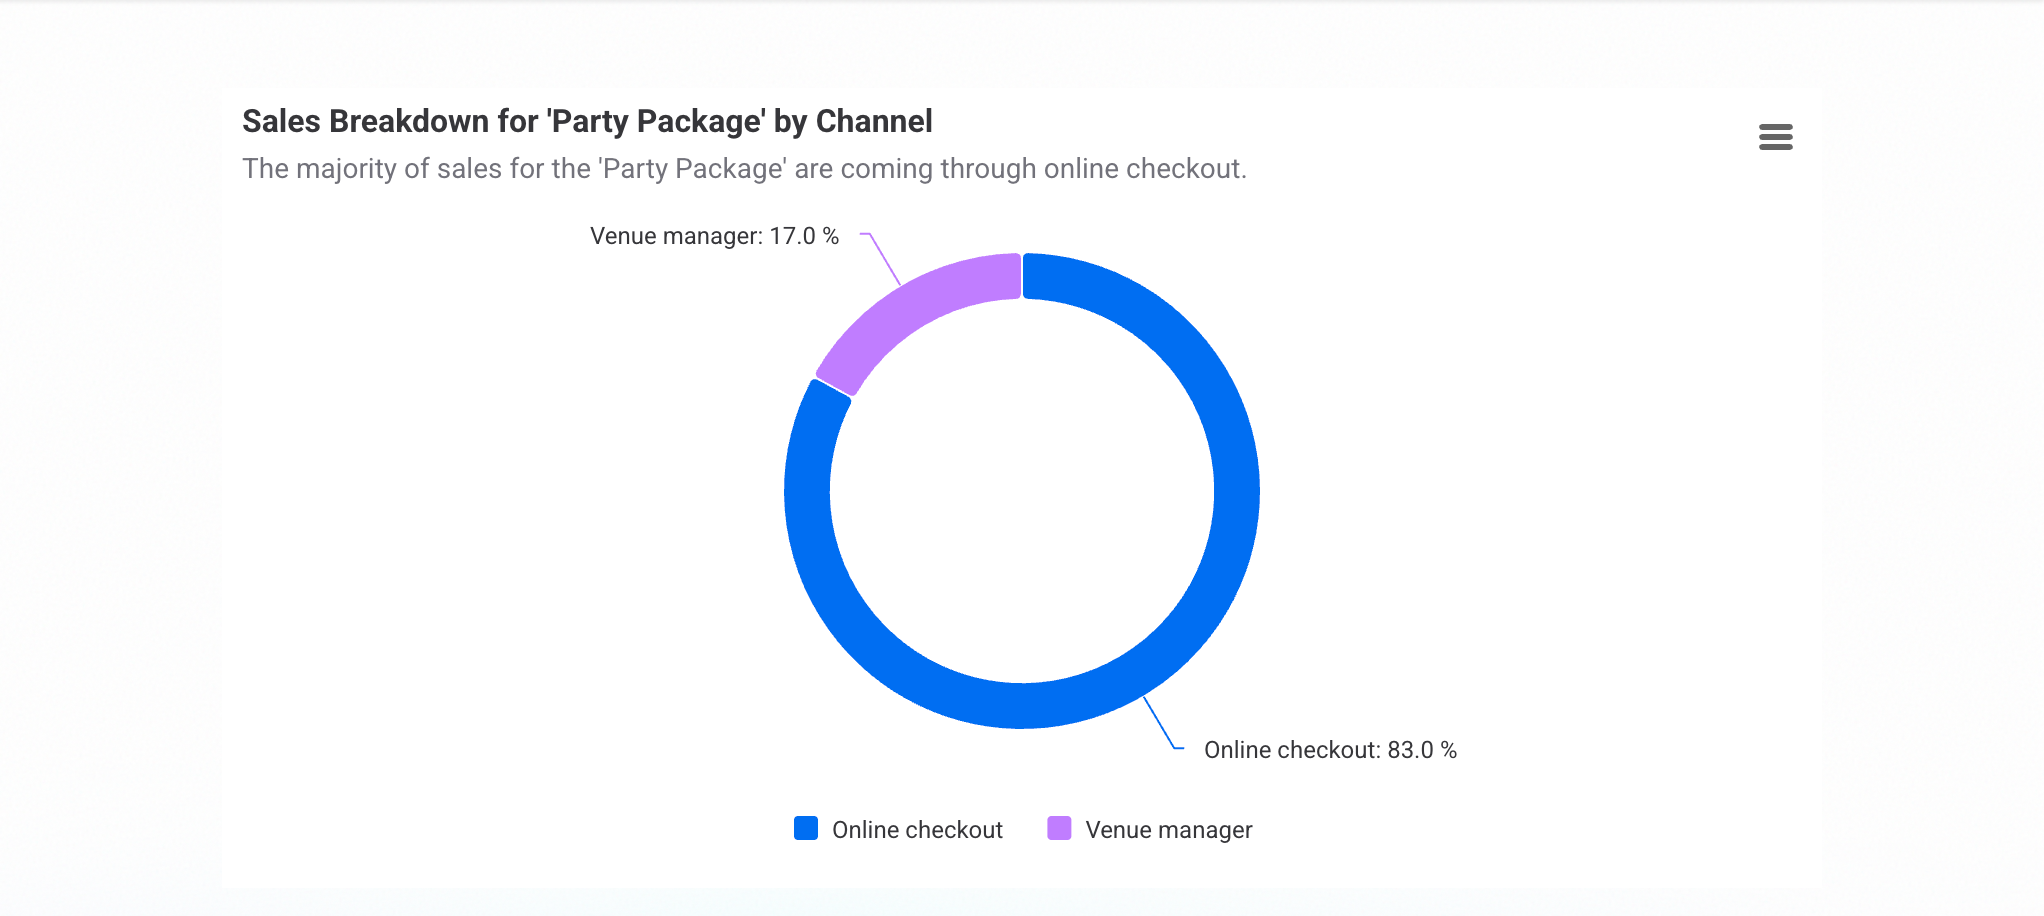
It’s the end of the month and you want to know what’s generated the most sales.
Start by asking:
What are my top 5 selling products this month?
Then, ask for an insight:
Can you give me a breakdown by sales channel for our top product.
Visualize revenue trends
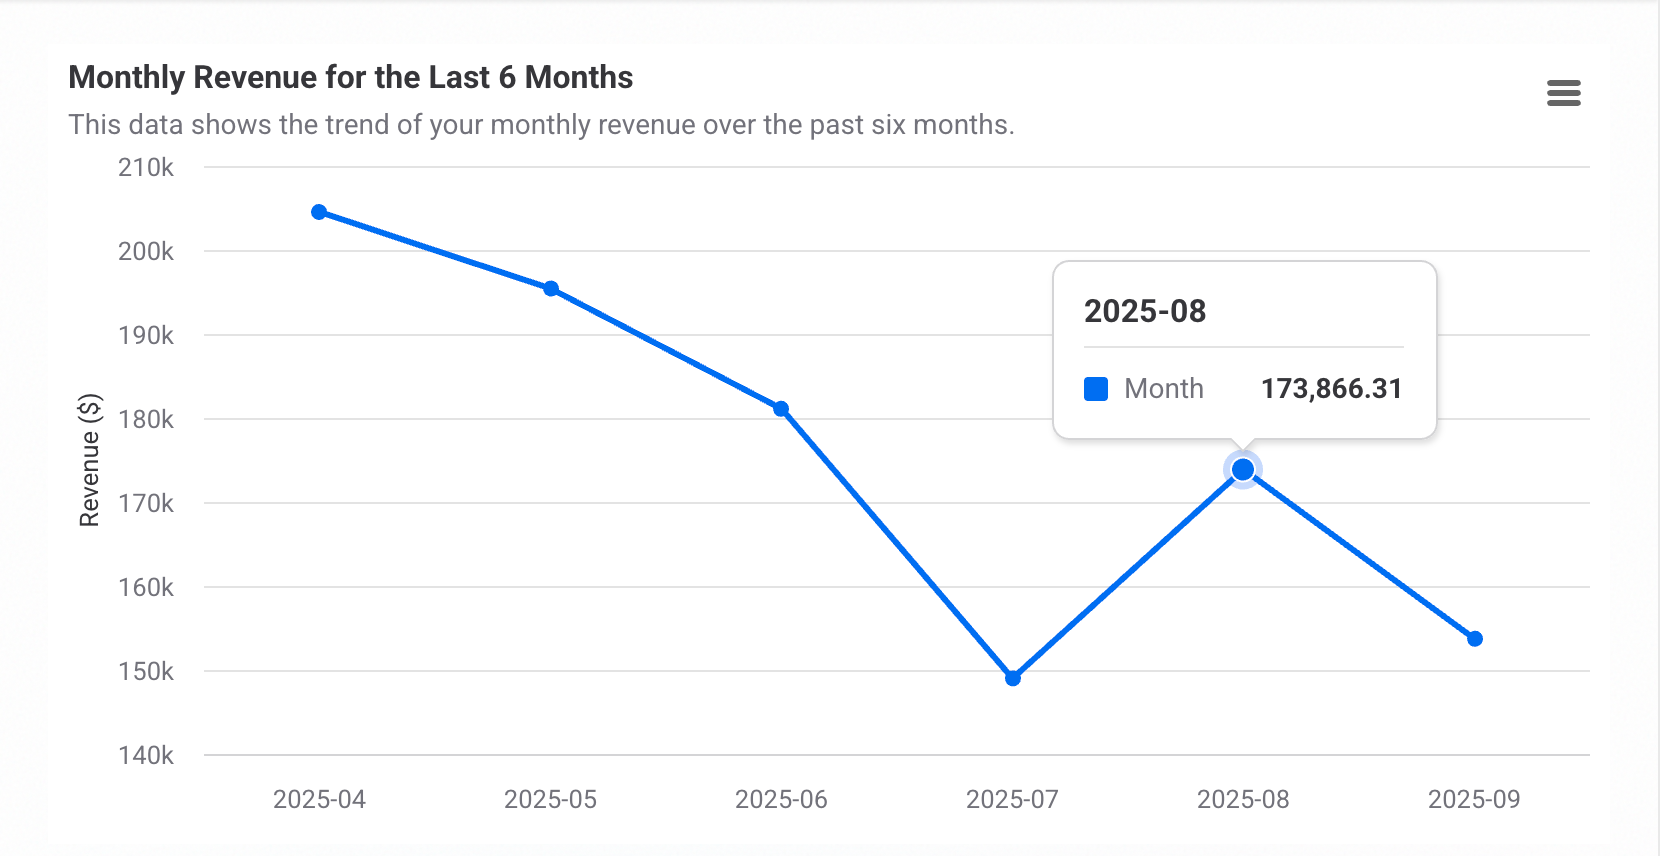
You're preparing for a quarterly business review and need to quickly visualize how revenue has been trending over the last half-year.
Start by asking for a chart:
Make a line chart of monthly revenue for the last 6 months
Then, find the biggest contributor to that trend:
Which product type generated the most revenue during that time?
Summarize guest feedback
To get the most from ROLLER iQ’s guest insights, make sure you're collecting guest feedback with guest surveys in ROLLER (all plans, except Legacy). iQ uses guest responses and ratings to analyze sentiment, identify trends and answer questions, such as what guests are saying about specific products or experiences. Learn more about how to set up your guest survey.
Use ROLLER iQ to turn survey responses, into actionable insights. These examples show how you can stay in tune with guest sentiment and create better experiences.
You can search for feedback on specific topics. Try asking about a product name, an event like "birthday parties," or a keyword like "cleanliness" to find relevant guest comments quickly.
Summarize feedback and get actionable insights
It’s the end of the quarter and you want to review guest feedback to decide what to improve next.
Start by asking:
Summarize guest feedback for the last 3 months and actions we should take.
Then, dig deeper:
Can you show me all feedback related to the most critical issue?
Identify your top-performing staff
You want to recognize and reward the team members who are creating the best experiences for your guests.
Start by asking for a ranking:
Who are our top party hosts based on guest feedback?*
Then, analyze the themes behind their success:
What are the common themes in their positive feedback?
*You'll need to assign party hosts to party bookings to see this.
Get help with ROLLER
Use ROLLER iQ as your first step for support to get step-by-step guidance without leaving your workflow.
When you're working on a specific task in Venue Manager, use the Ask ROLLER iQ button to open the sidebar. It's the fastest way to get contextual help without losing your place.
Create a time-based price rule
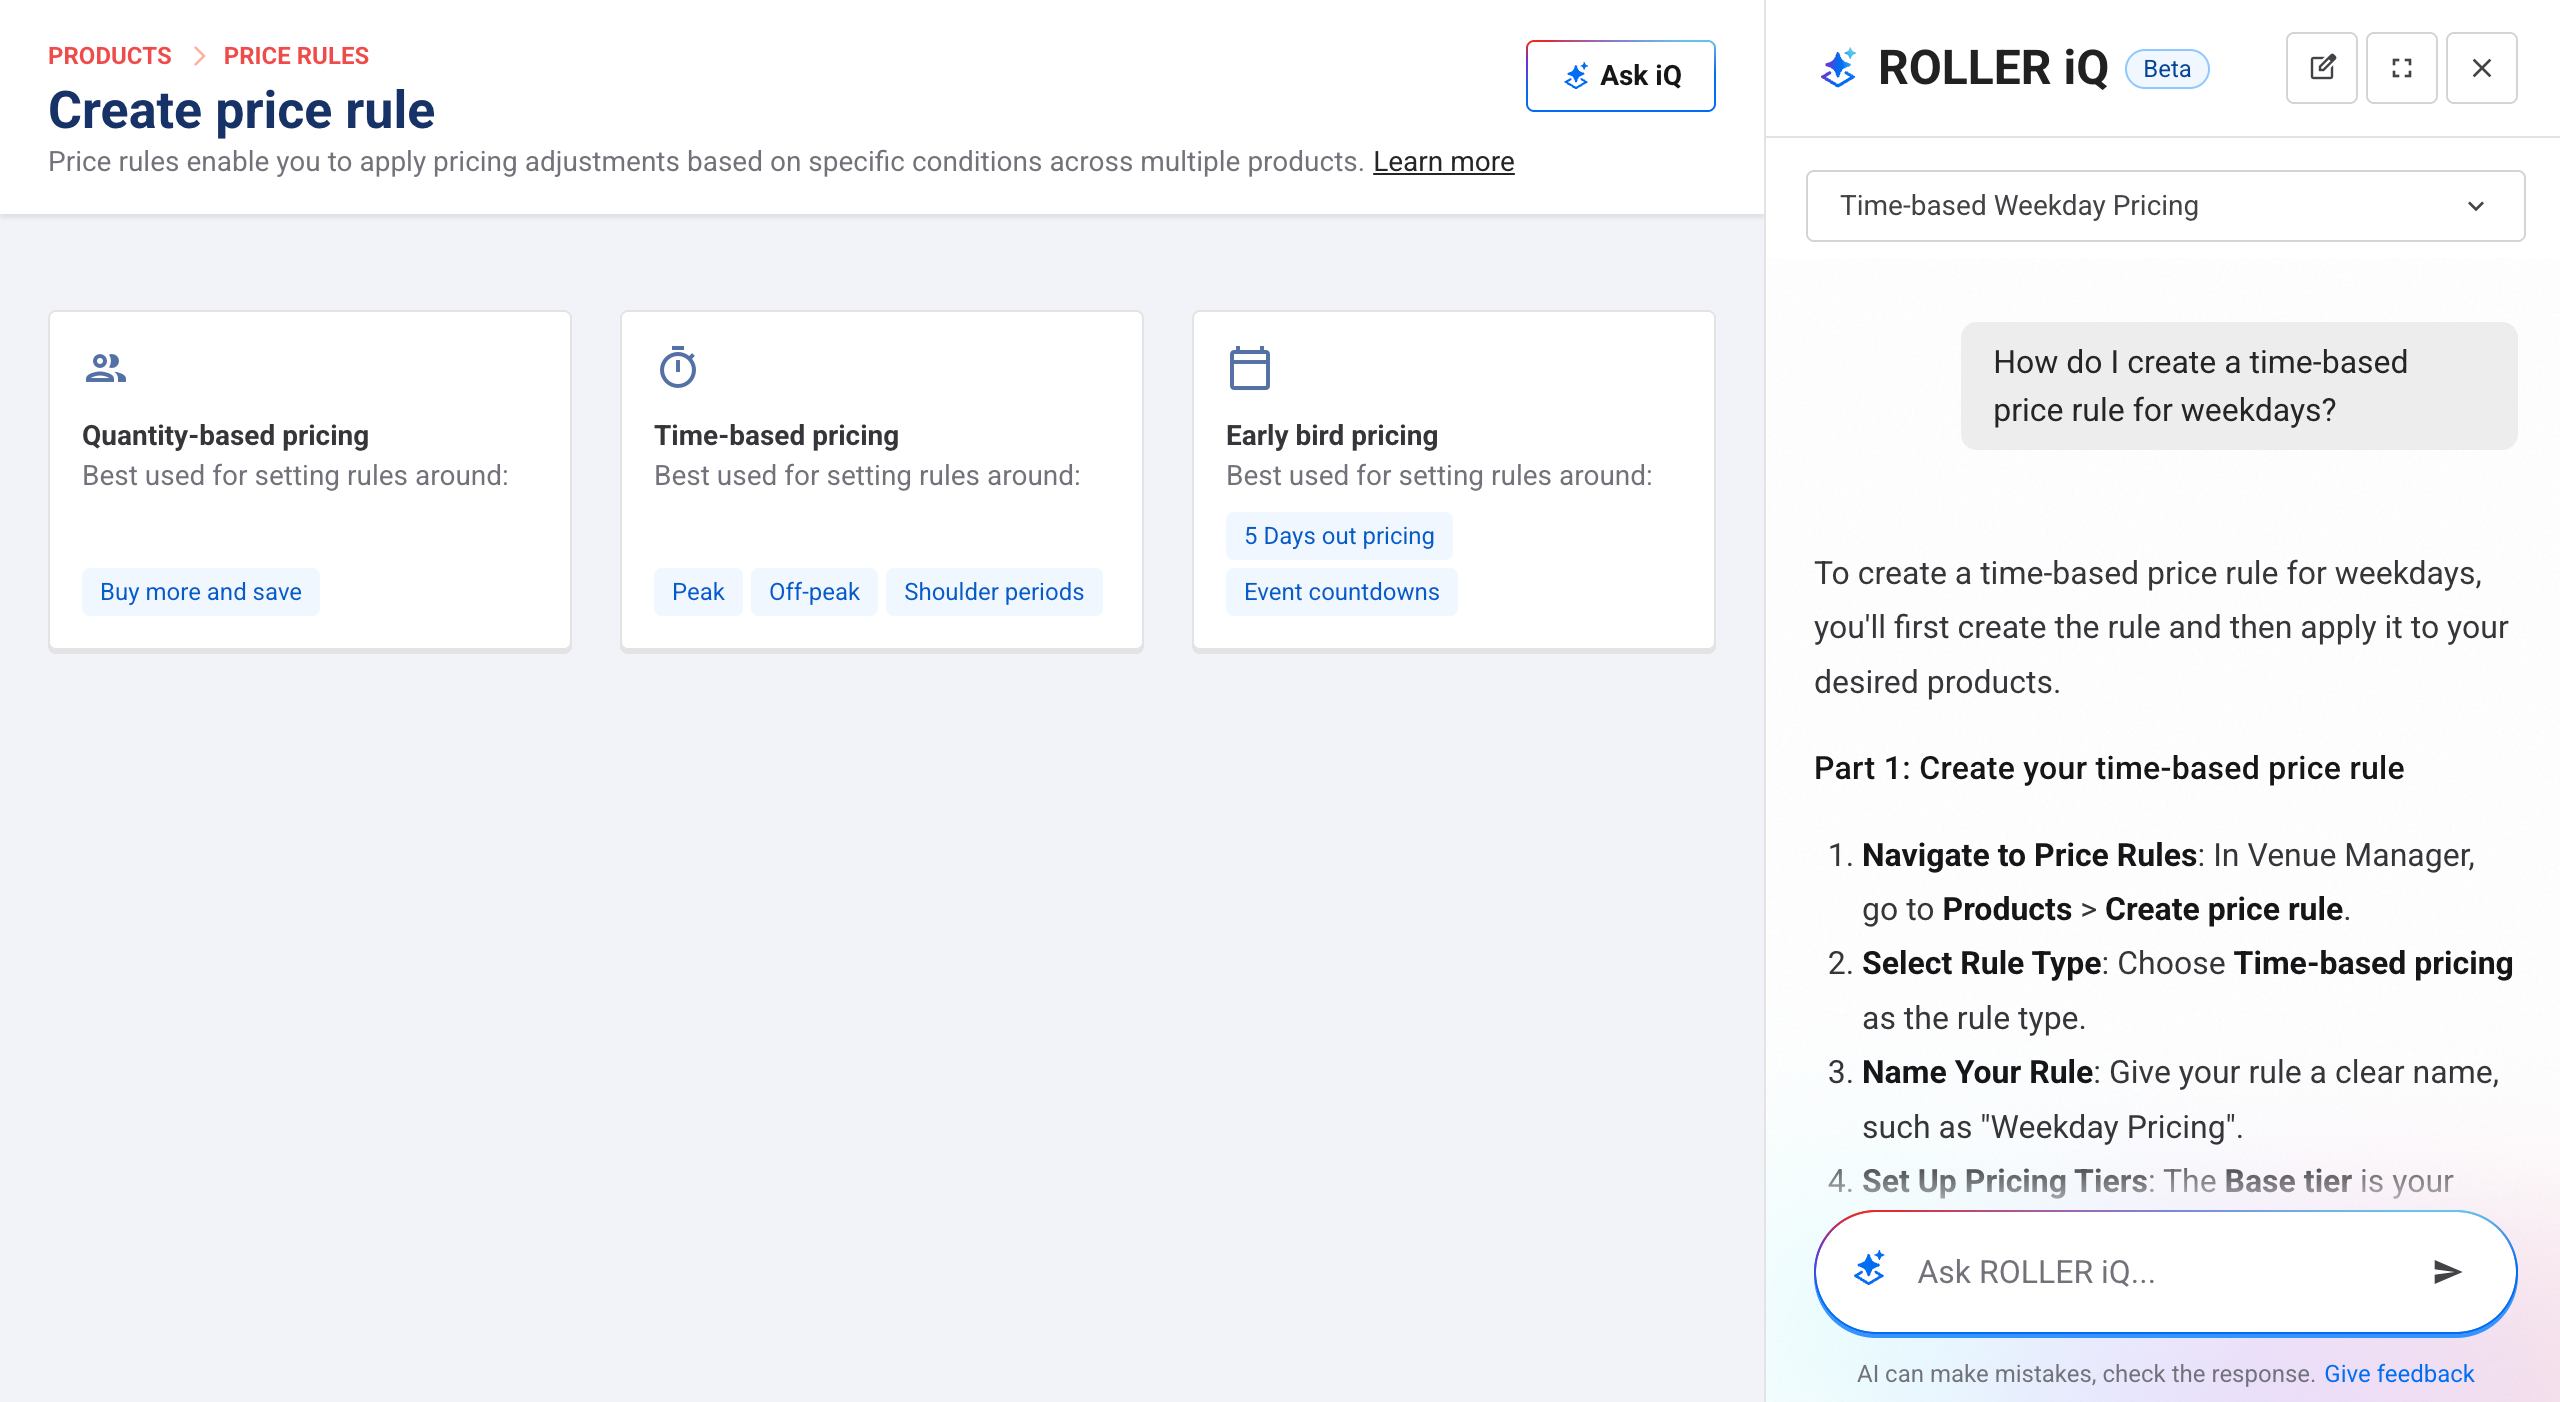
You’re looking to boost attendance during slower weekday afternoons by offering a limited-time discount on your popular “60-minute Jump Pass.”
Start by asking for instructions:
How do I create a time-based price rule for weekdays?
Then, ask about the next step in the process:
Now, how do I apply that new rule to my "60-minute Jump Pass" product?
Understand key business metrics
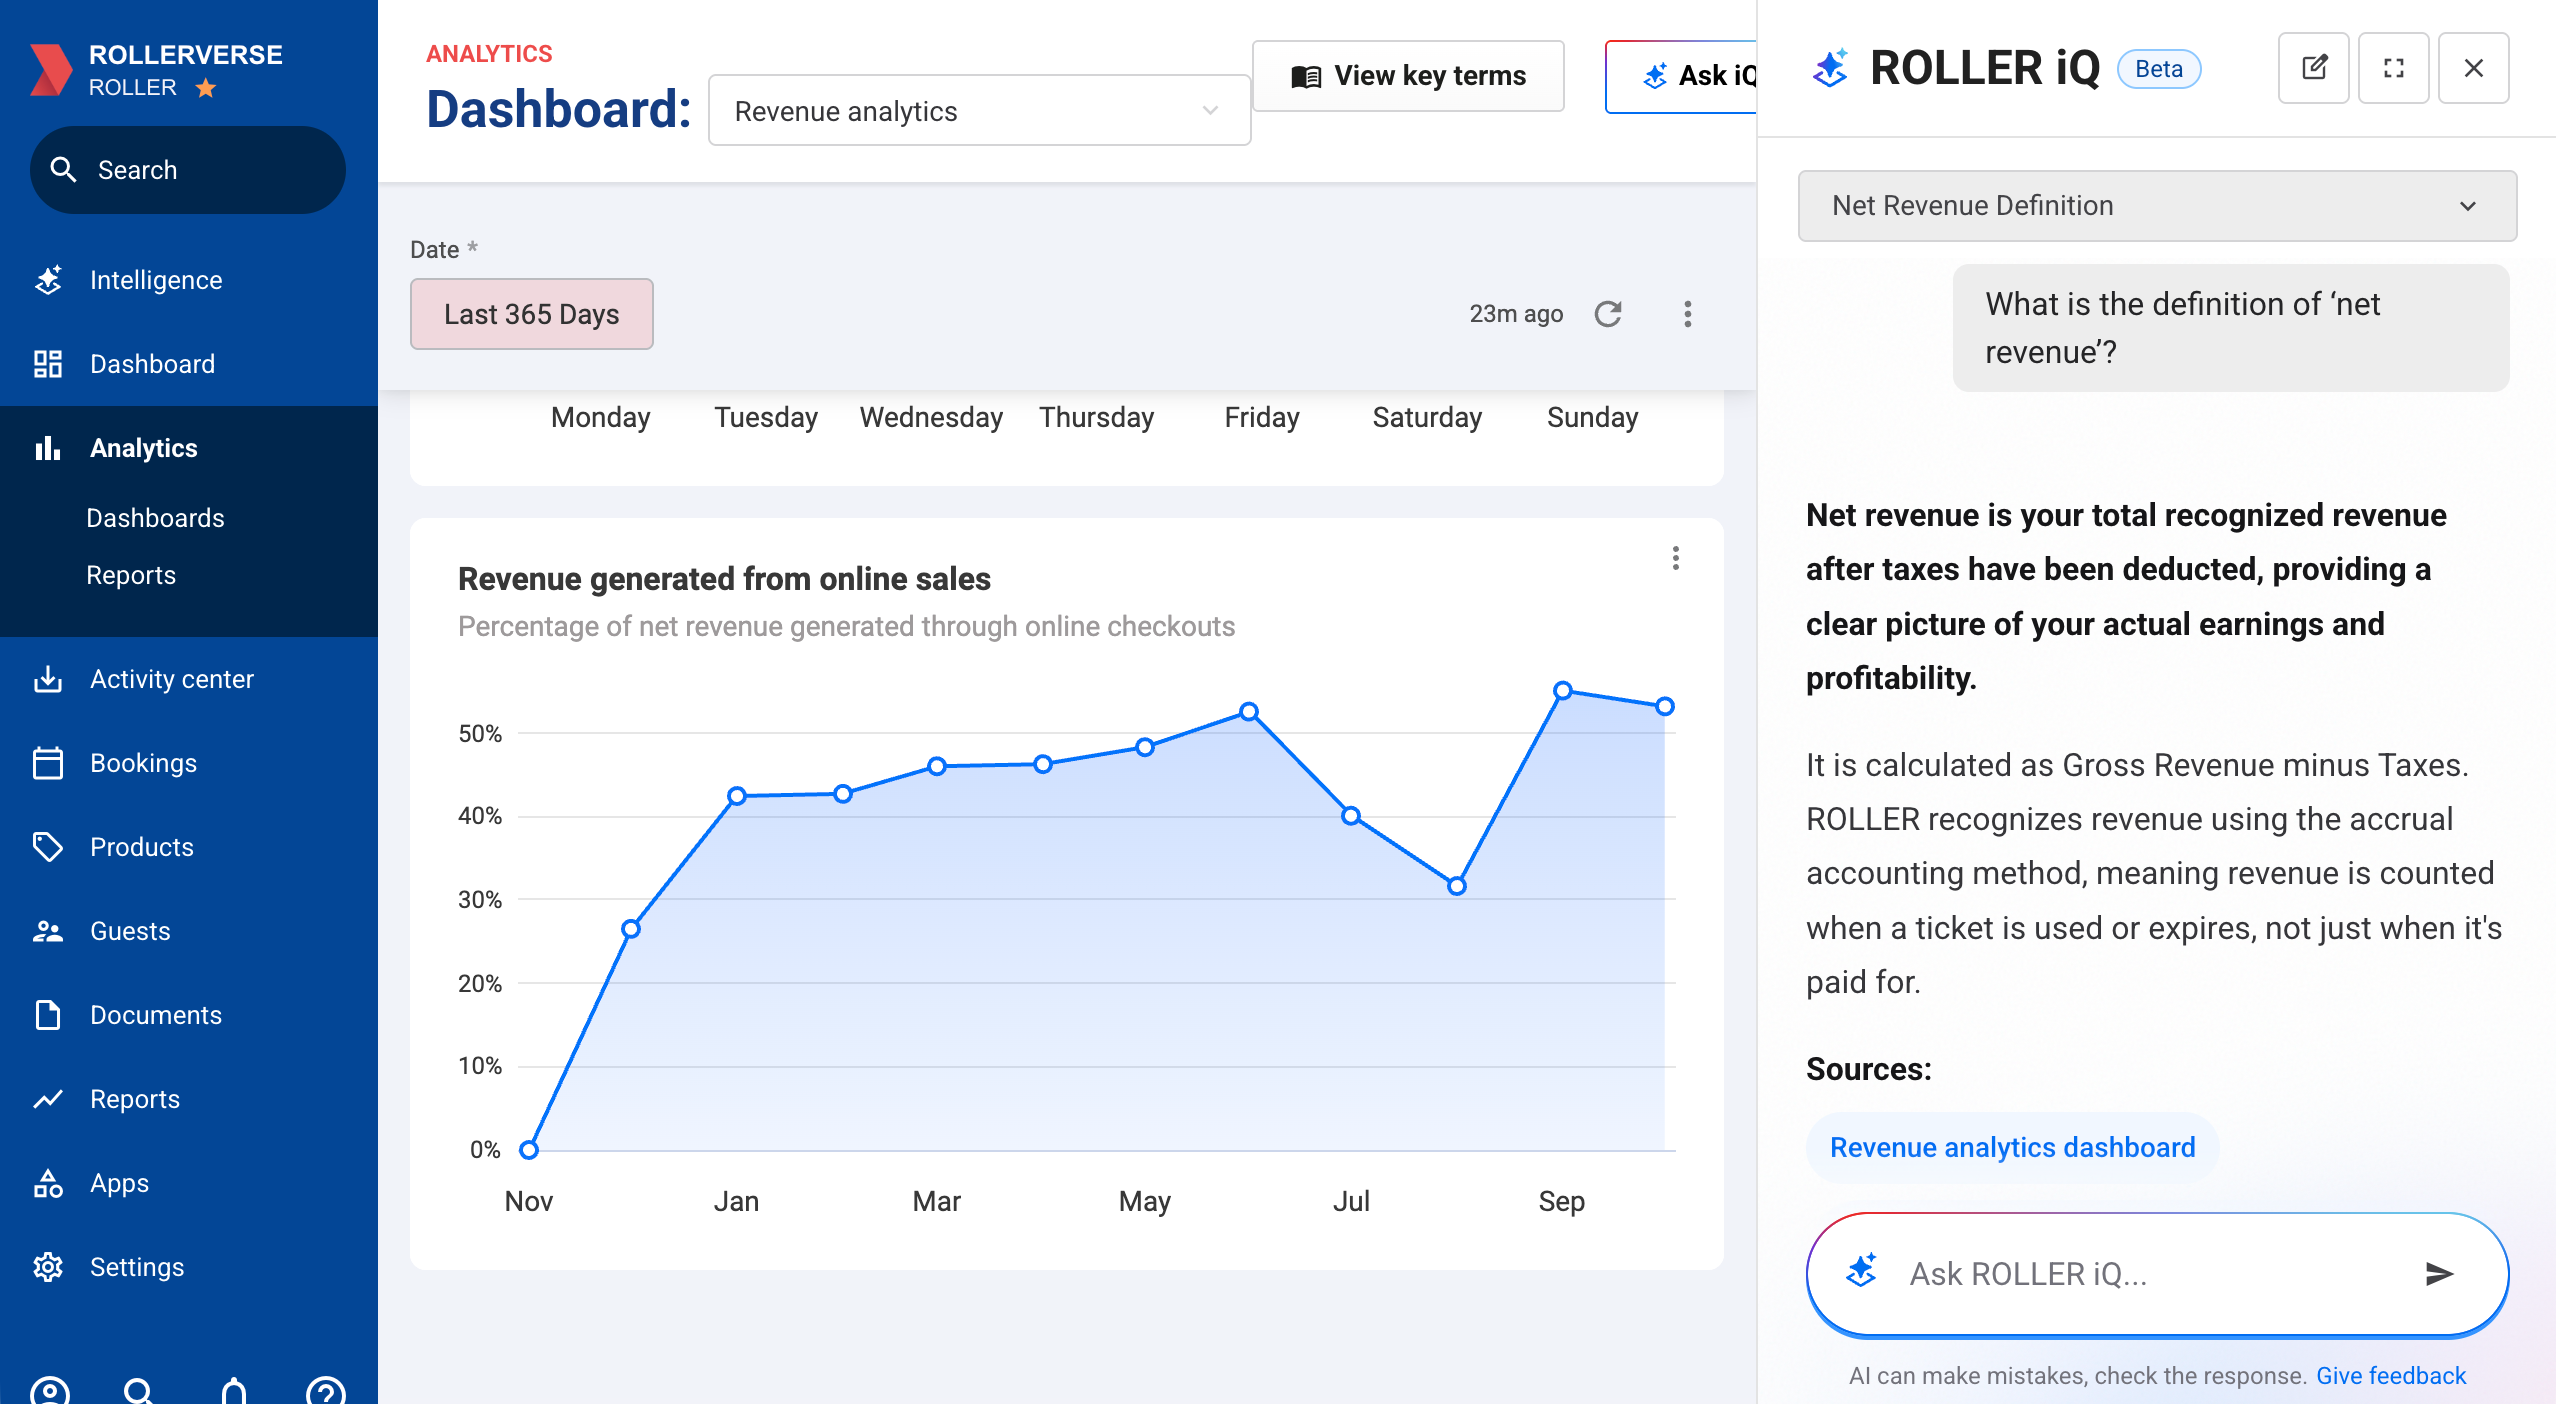
You’re reviewing your Revenue analytics dashboard and want to understand exactly what a specific metric means.
Start by asking for a definition:
What is the definition of ‘net revenue’?
Then, ask for a comparison to clarify:
How is that different from ‘funds received’?
Empower your team with in-app training
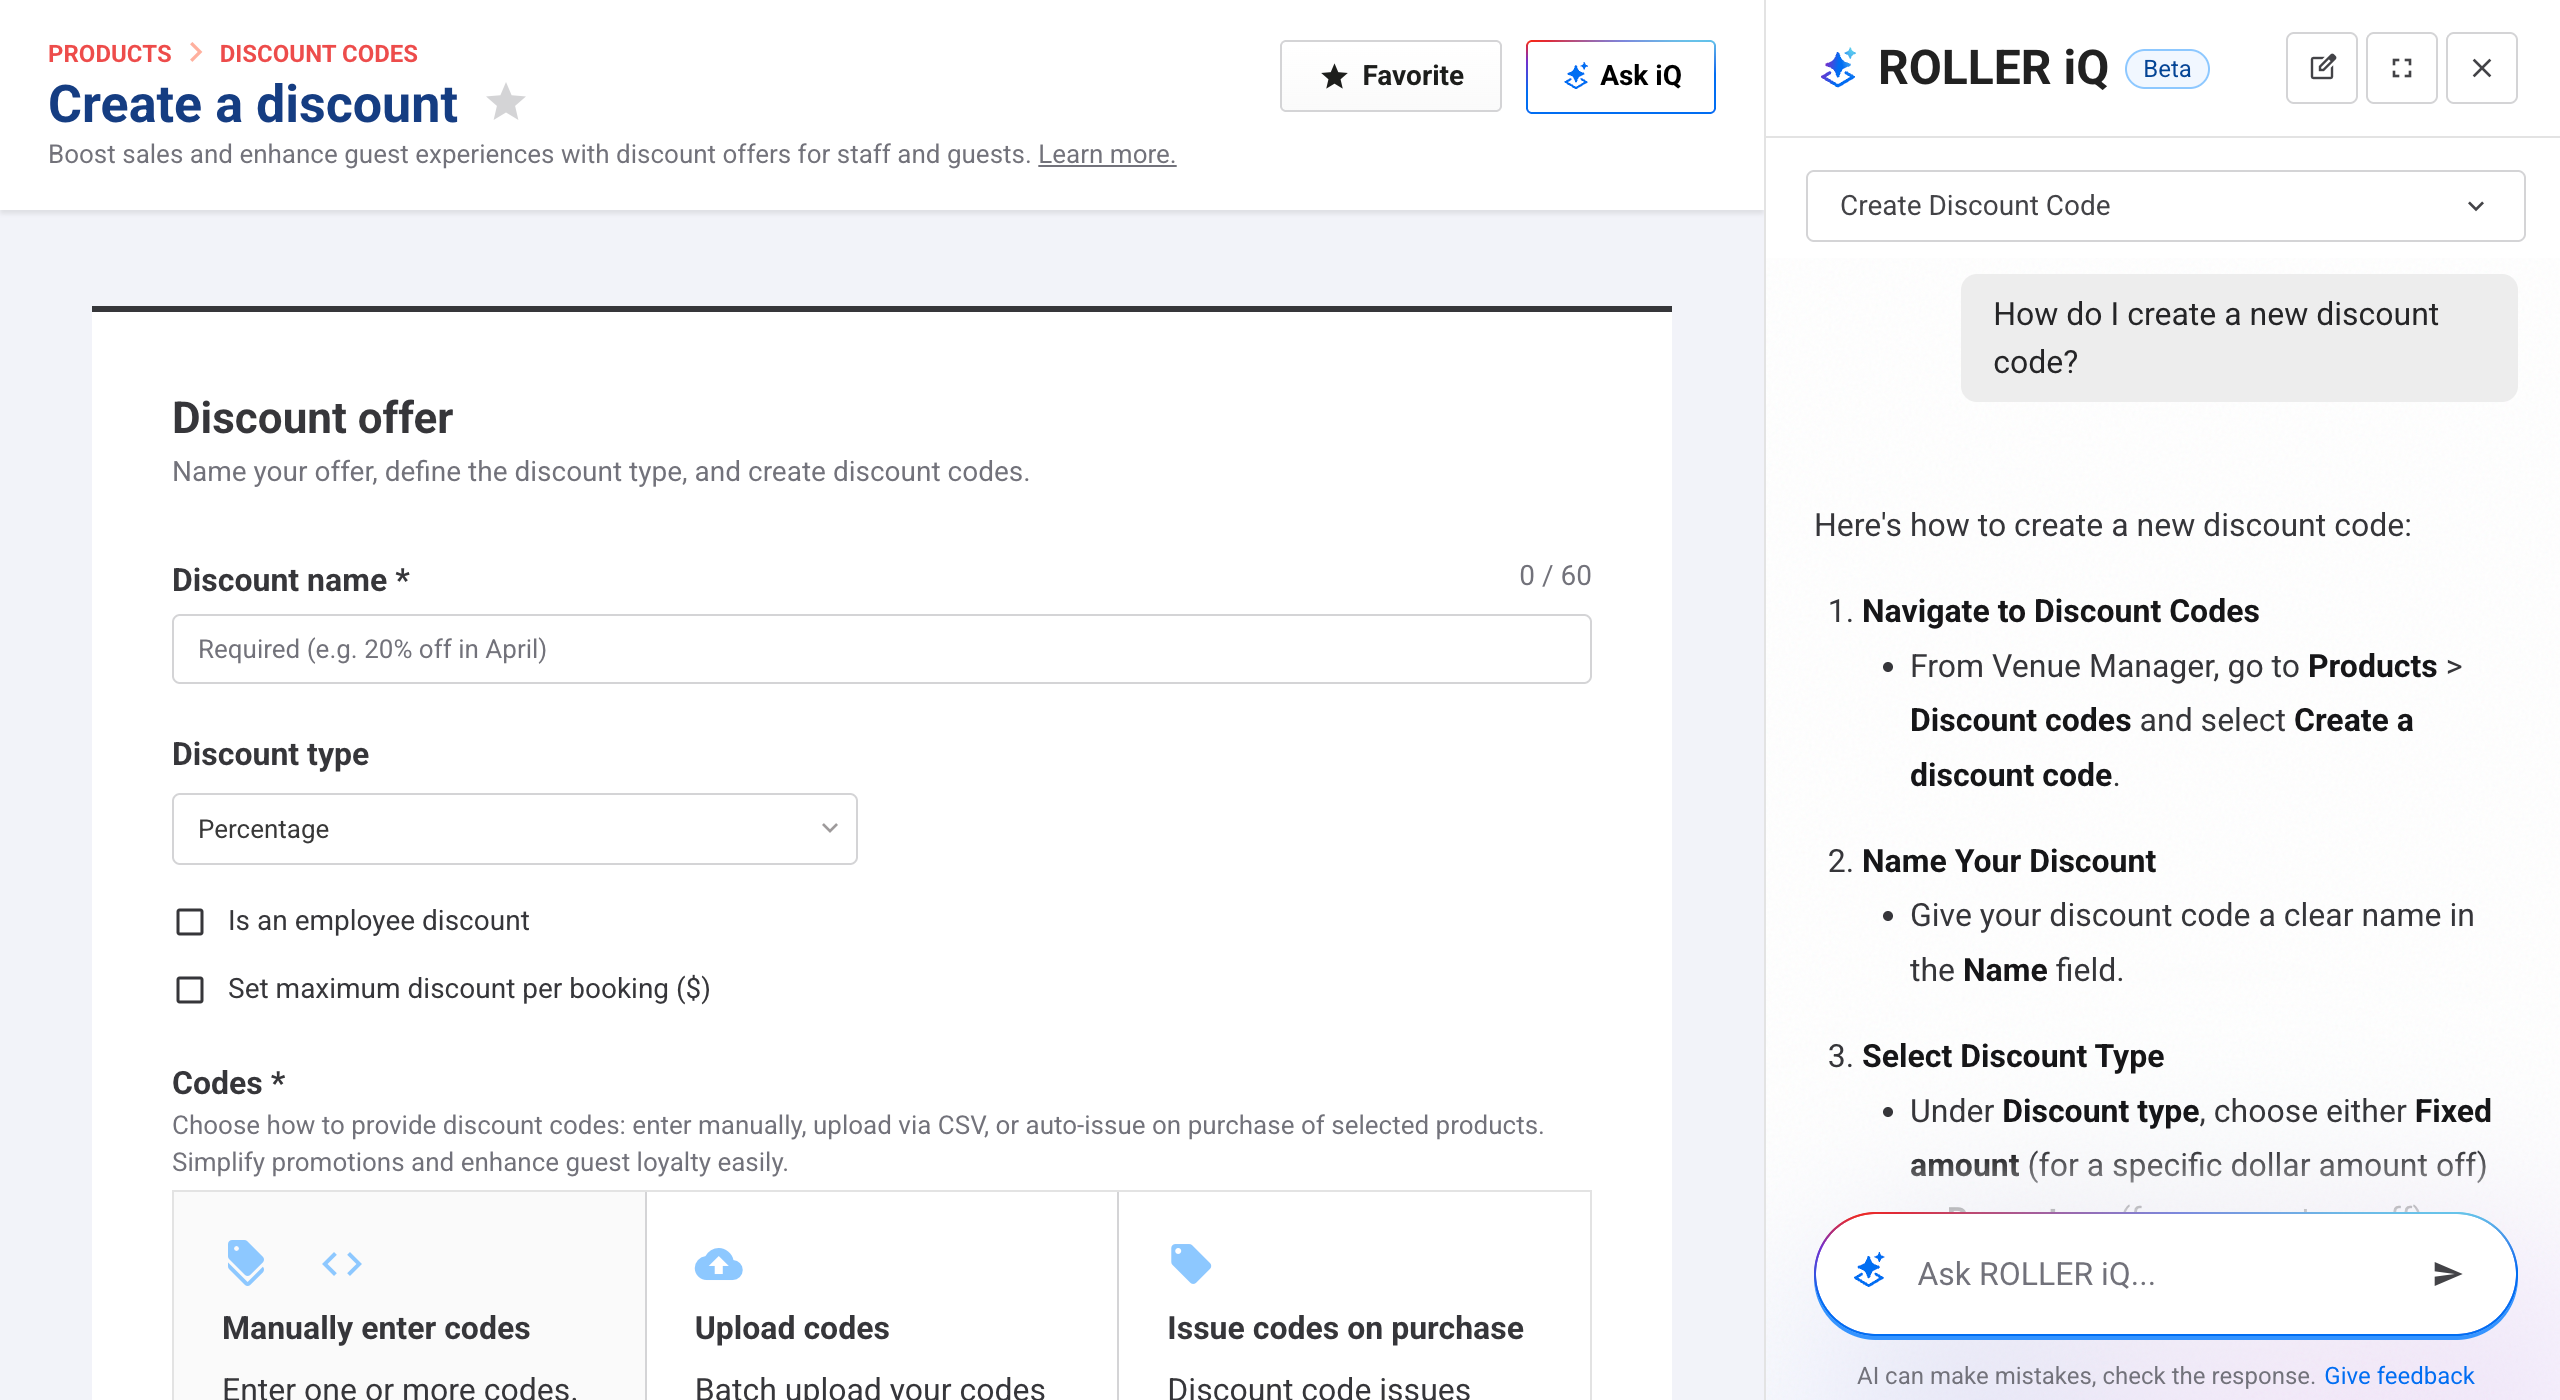
You're a busy manager and need a team member to create a new discount code for an upcoming promotion, but you don't have time to walk them through the process yourself.
Have your staff member ask for instructions:
How do I create a new discount code?
Then, have them ask for help with a specific rule:
How can I make sure that code can only be used once per customer?
Important considerations
ROLLER iQ helps you act, not take action (yet)
At launch, ROLLER iQ can’t make changes in your account, like creating a product or updating settings. Instead, it gives you insights, guidance, and step-by-step support so you can take action with confidence. The ability for ROLLER iQ to perform tasks directly is planned for the future.
Use ROLLER iQ as a guide, not a final answer
ROLLER iQ is designed to help you explore your data and get quick answers — but like all AI, it may occasionally get things not quite right. Use it to support your decisions, not replace your judgment.
Some answers may differ from Analytics
You might notice small differences between ROLLER iQ responses and your Analytics dashboards. That’s because ROLLER iQ often uses broader methods to kick off a conversation. If you need exact figures, your dashboards are still your best reference point.
ROLLER iQ helps you get answers faster
Think of ROLLER iQ as a shortcut to insights you’d normally dig up in a report. When you want a deeper dive, your existing dashboards are still there and fully available.
Getting the best results
ROLLER iQ works best with clear, focused questions. Use the following tips to get the best results:
Tip | Example questions |
|---|---|
Ask one question at a time | “What was our revenue last weekend?” instead of |
Add comparisons | “How are this weekend’s bookings tracking compared to last week?” |
Segment your questions | “Which product types are driving the most revenue this month?” |
Drill down | After asking about revenue, follow up with “What’s driving the most revenue growth compared to last month?” |
Use it for support too | “How do I create a discount code for next weekend’s sessions?” |
Example questions to try:
“How many bookings are there today?”
“What was our revenue last weekend?”
“How are this weekend’s bookings tracking compared to last?”
“What are the top 5 products this month?”
“What’s driving the most revenue growth compared to last month?”
“Make a line chart of monthly revenue for the last 6 months”
“How do I create a discount code for next weekend’s sessions?”
“What has the guest sentiment been like for the last 90 days?”
“What can ROLLER iQ do?”
ROLLER iQ provides guidance, not final answers. Use its insights to support your decisions, not replace your judgment.
Troubleshooting
If ROLLER iQ doesn't give the answer you expect on the first try, here are a few things you can do:
Try again
Sometimes the system may have a temporary issue. Asking the same question again can often resolve it.
Be more specific
If your first question was broad, rephrase it with clearer details. For example, instead of "the last few days," try "the last 3 days" for a more precise answer.
Check how ROLLER iQ understood you
You can ask, “How did you understand my question?” This helps you see how iQ interpreted your request and refine your wording if needed.
Expect small differences from Analytics
ROLLER iQ often starts with a broader calculation method to encourage conversational follow-up questions. Slight differences in data when compared to a fixed Analytics dashboard are expected and are not an error.
Start a new conversation for a different topic
ROLLER iQ uses the context of each conversation to give better answers. If you’re switching to a different topic, it’s best to start a New conversation. This helps avoid confusion and gives you a more accurate answer.
Giving feedback
Your feedback goes straight to the ROLLER iQ team and helps shape future improvements. By sharing your thoughts, you’re helping build a better experience for everyone.
There are two ways to give feedback:
Rate a response
Below each answer, select the thumbs up or thumbs down to let us know if it was helpful.
Share detailed feedback
To share more detailed thoughts:
Select Give feedback in the top-right corner of the page
In the window that appears, enter your feedback
Select Send feedback to submit
What makes feedback helpful?
Detailed, specific feedback helps us improve faster. Here are some examples of useful feedback:
The response was inaccurate
“The revenue number ROLLER iQ gave me for last Saturday was incorrect.”
The answer didn’t match the question
“I asked for booking numbers, but it gave me revenue data instead.”
The response was unclear
“It gave me a list of products but didn’t explain which one was the top performer.”
You have a feature suggestion
“I wish ROLLER iQ could create a new discount code for me.”
FAQs
How is ROLLER iQ different from other AI tools?
ROLLER iQ is built specifically for the attractions industry. It uses your venue’s data, including bookings, capacity, guests, and events, to surface insights that are tailored to your business.
Does ROLLER iQ replace my dashboards and reports?
No. ROLLER iQ helps you find answers faster, but it doesn’t replace your reports. You’ll still have full access to your dashboards when you want to explore your data in more detail.
Can ROLLER iQ make changes in my account?
Not yet. ROLLER iQ provides insights, recommendations, and step-by-step guidance, but it can’t make changes for you. This capability is planned for the future.
Who on my team can use ROLLER iQ?
To use ROLLER iQ, your venue must first be granted access. You can register your interest using the early access form on this page. Our team is rolling out access in phases and will contact you with next steps.
Who has access is controlled by role permissions:
Access is automatically enabled for the Administrator and Manager system roles and any custom roles based on them.
Administrators can then grant or remove this permission for other custom roles
Staff members with the Can use ROLLER iQ permission can see all data available in ROLLER iQ. This may include data that isn’t visible to them elsewhere in Venue Manager.
How up to date is the data?
ROLLER iQ uses near real-time data. Booking and revenue data refreshes every 60 to 90 minutes (the same as Analytics).
Is my venue’s data secure?
Yes. ROLLER iQ follows the same security and privacy standards used across the ROLLER platform. Your data is never shared with other venues.