This report gives you a deeper understanding of how much your guests spend on party package bookings. It shows the average amount spent per party on party tickets during a specific period of time. This information can help you maximize your revenue potential by optimizing your party and group offerings.
All plans except Lite Legacy or Pro Legacy plans
To unlock this report, reach out to your customer success manager or the support team.
Questions answered
What is the average spend on tickets per party booking each month?
How has the average party value trended over the past year?
Are there specific months where party value peaks or dips?
A party booking refers to a reservation that includes a party package product.
Actionable insights
Identify trends in party package spending, which can inform pricing and promotional strategies.
Adjust offerings and packages based on the average party ticket spend to maximize revenue.
Plan for expected fluctuations in party bookings throughout the year.
Access the report
The permission Can access Analytics is required to view dashboards and reports. Administrator and manager system roles have this permission enabled by default.
From Venue Manager, go to Analytics > Reports.
Search for and select Average party value by month.
Interpret the visualization
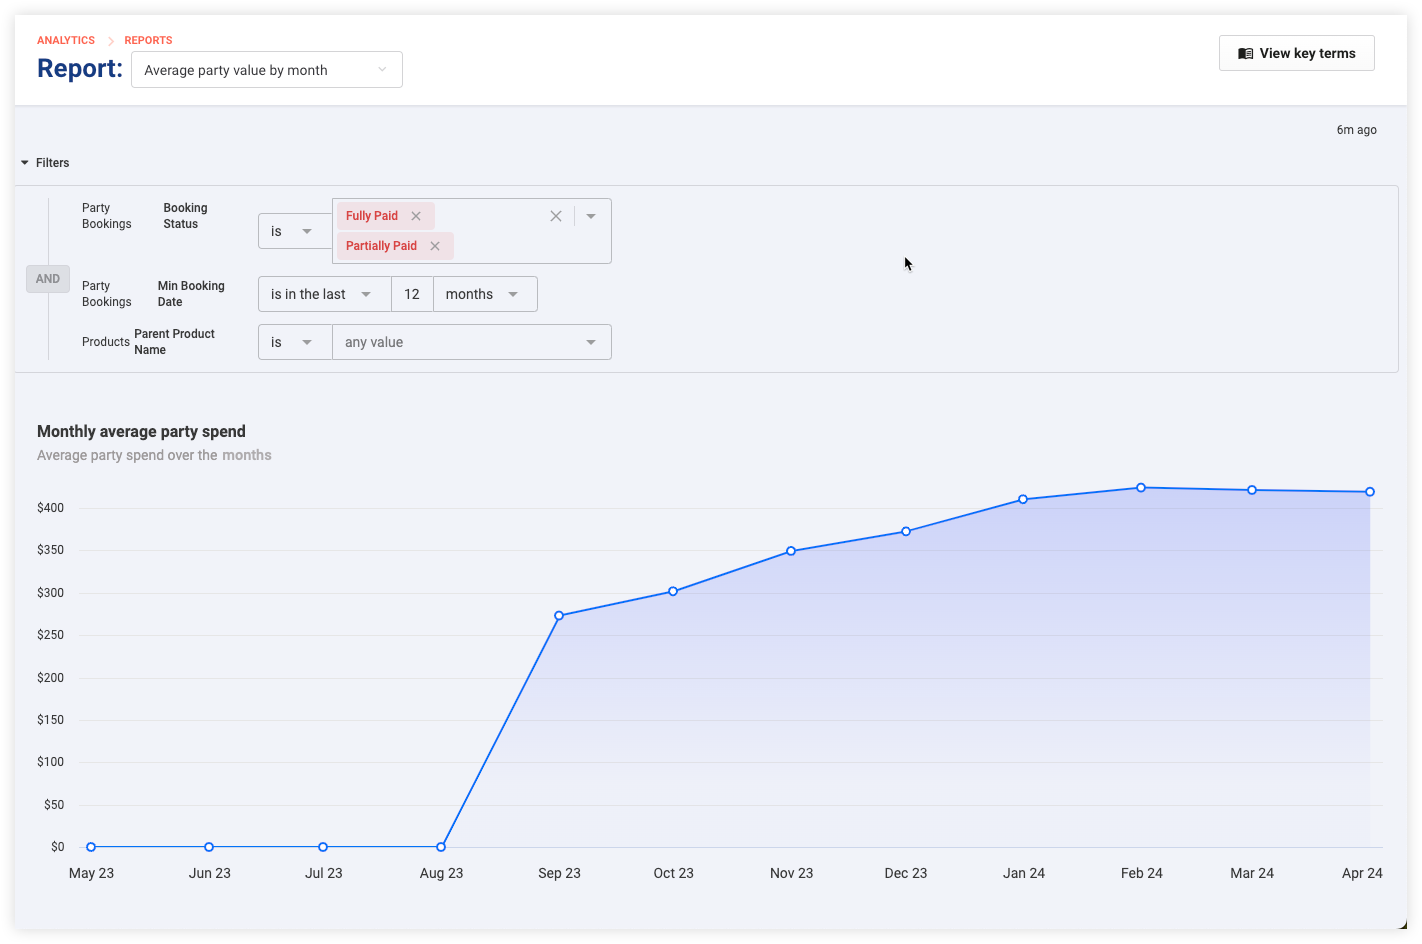
The report features a line graph that illustrates the average party value over the selected months. The default timeframe is in the last 12 months.
Regularly monitor this report to see patterns in spending trends and increases or decreases in the average party value over time.
Use the filters
The report comes with pre-set filters that can be customized for a more focused analysis.
Select Filters at the top left of the report page.
Review and understand the default filters currently applied.
Modify filters using the drop-down menus, calendars and entry fields.
Remove filter values by selecting the X to the right of a selected item.
Select Run to update the report with the new filters.
Any changes to filters are temporary and will revert back to default upon reopening the report.
Filter | Options |
|---|---|
Booking Status | Default filters include Fully Paid or Partially Paid bookings. Choose different booking statuses from the drop-down. |
Min Booking Date | Default is to show bookings with a booking date (event date) scheduled in the last 12 months. Use the drop-down filters to choose a different timeframe or date range. |
Parent Product Name | Parent product name is the overarching product for the tickets available. Initial settings include all party package products. Filter on specific party package products by selecting them from the drop-down. |
Learn more about how you can filter, interact with and download the data in reports.
FAQ
What does the Average party value by month report show?
This report displays the average spend on tickets for party bookings each month, helping you understand guest spending behavior. Party spend includes the cost of the base party tickets and additional tickets in the package, excluding bundled stock and add-on items, upsell products and other products in the booking.
How can this report help in party planning?
By identifying spending trends, businesses can target their party and group offerings to align with guest preferences and spending habits.