Analytics visualizes your business data, enabling you to track key performance metrics over time. This guide will show you how to locate, filter, download and interact with dashboards and reports.
The permission Can access Analytics is required to view dashboards and reports. Administrator and manager system roles have this permission enabled by default.
Find your way around Analytics
Start by exploring the pre-built dashboards and reports. Dashboards let you track multiple metrics from one place, while reports allow you to analyze a specific metric in more detail. Both dashboards and reports have similar elements that allow you to filter, download and interact with the data.
Access visual dashboards
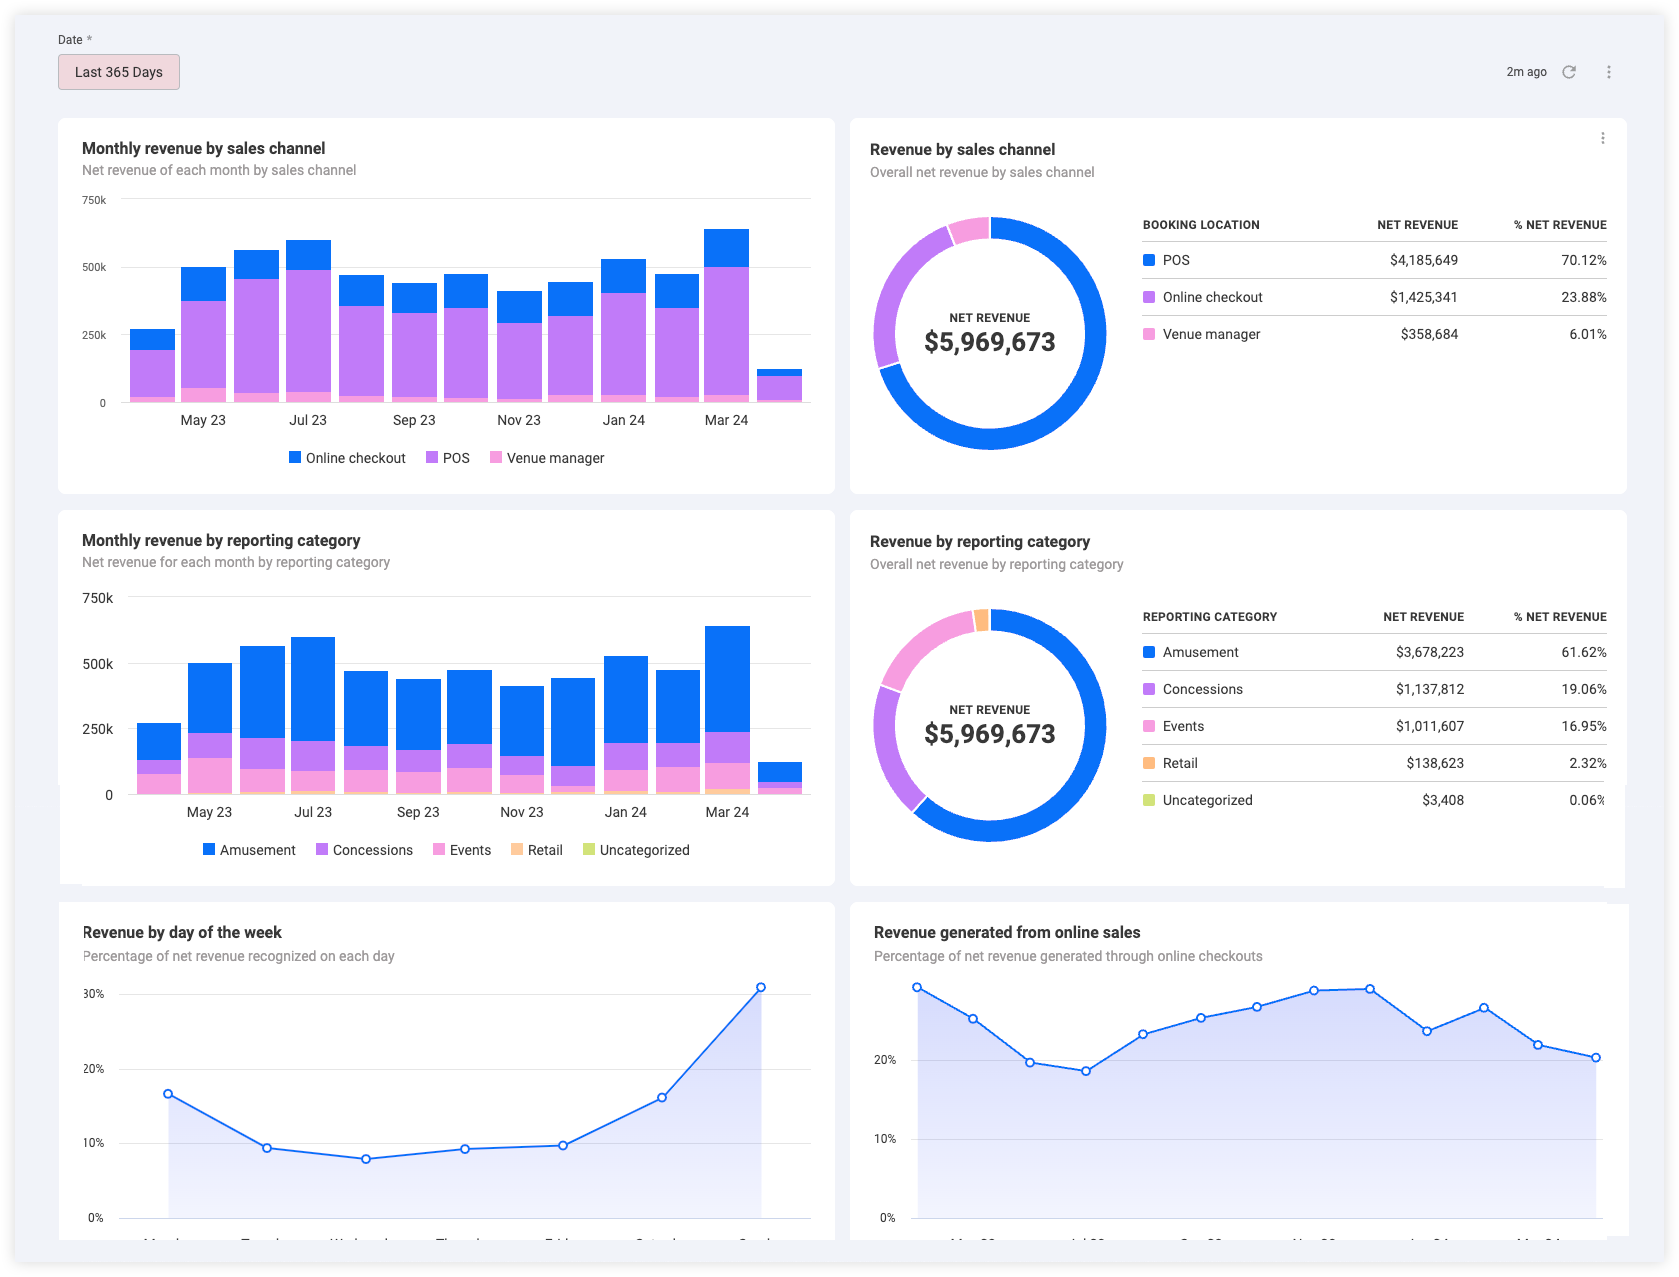
Visual dashboards provide a snapshot view of key business growth metrics, such as venue performance, guest visitation, membership growth and revenue.
From Venue Manager, go to Analytics.
The default Revenue analytics dashboard opens.
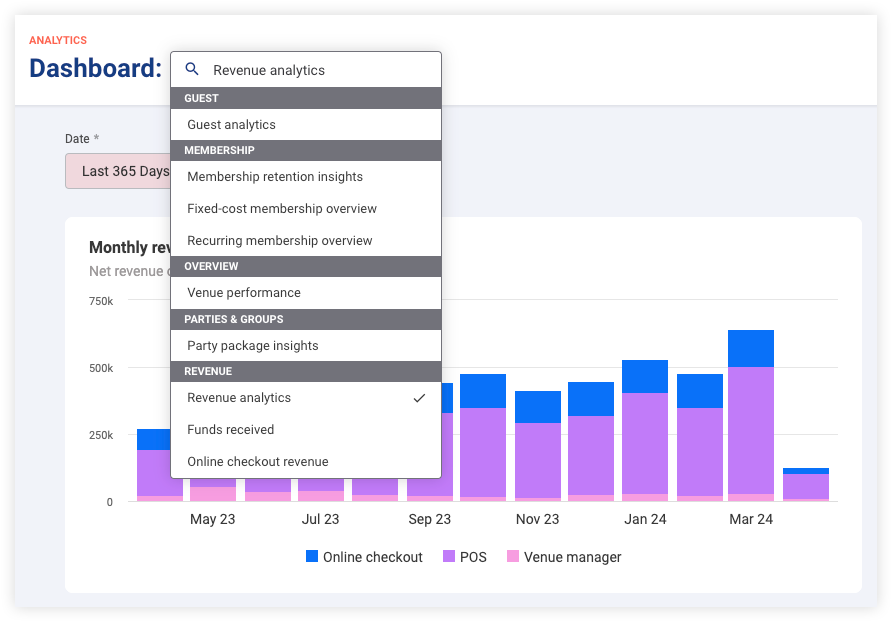
Switch dashboards using the drop-down at the top of the page, or go to Analytics > Dashboards for a full list.
Access visual reports
Visual reports provide detailed analyses of singular visualizations, allowing you to monitor metrics such as deferred revenue, discount code usage and monthly revenue year-over-year comparisons.
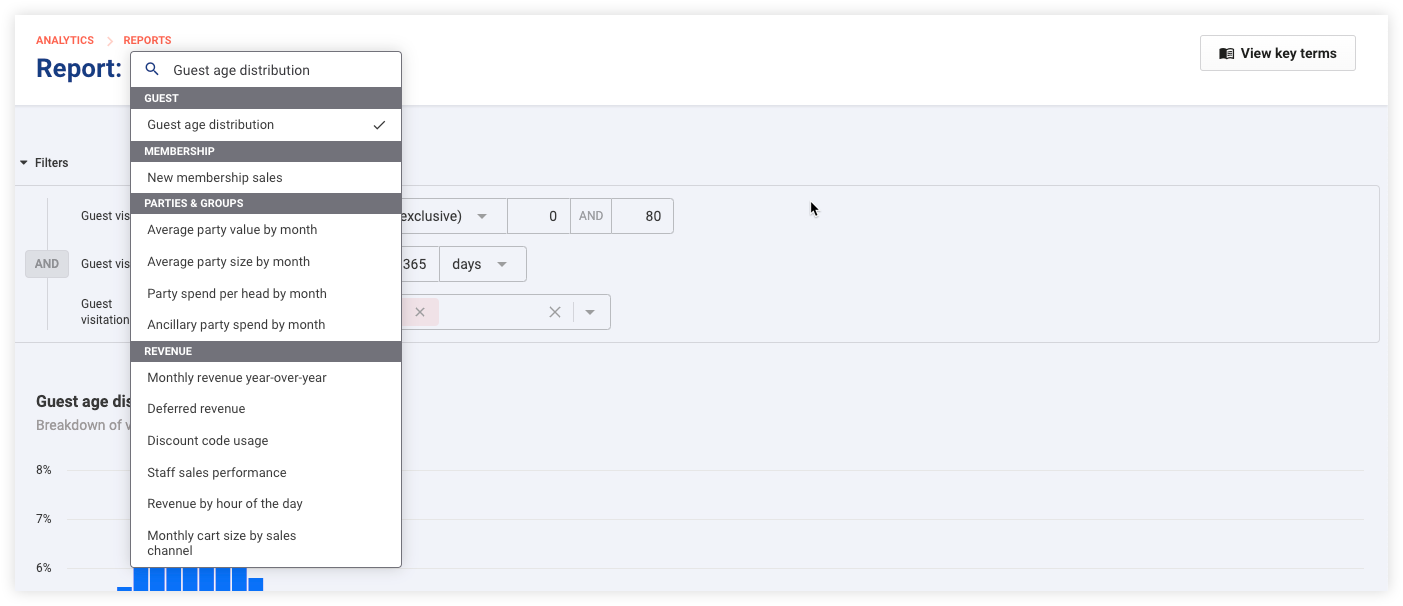
From Venue Manager go to Analytics > Reports to see a list of all available reports.
Browse the list of available reports and select a report to open.
The report opens with any default filters applied.
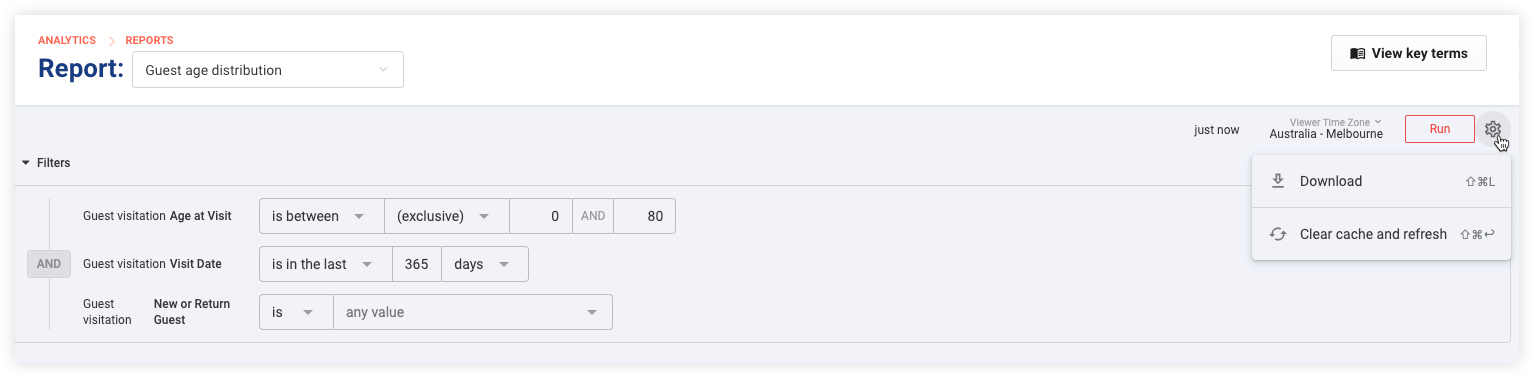
Expand Filters at the top left of the report to view the filters. Read on to learn more about modifying the filters.
Use the drop-down at the top of the page to switch reports.
Change the default dashboard
When you initially access Analytics, the default dashboard that opens is the Revenue analytics dashboard. To change the default dashboard:
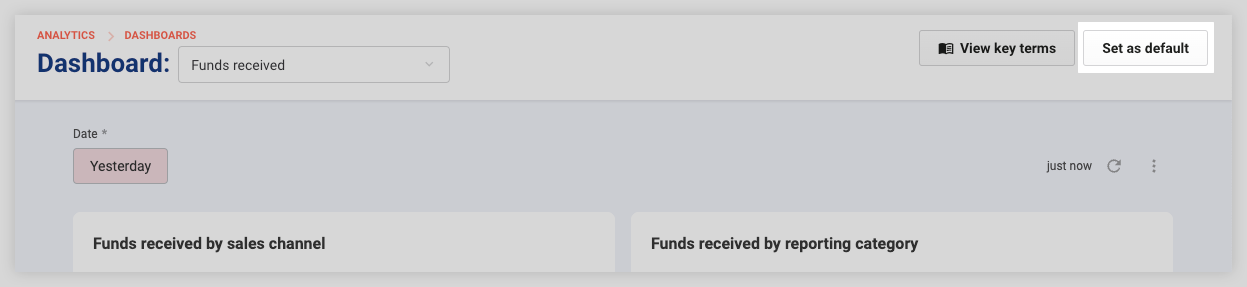
Open the dashboard you want for the default, then select Set as default at the top right. For example, if you're using cash accounting for your business, open up the Funds received dashboard, then select Set as default.
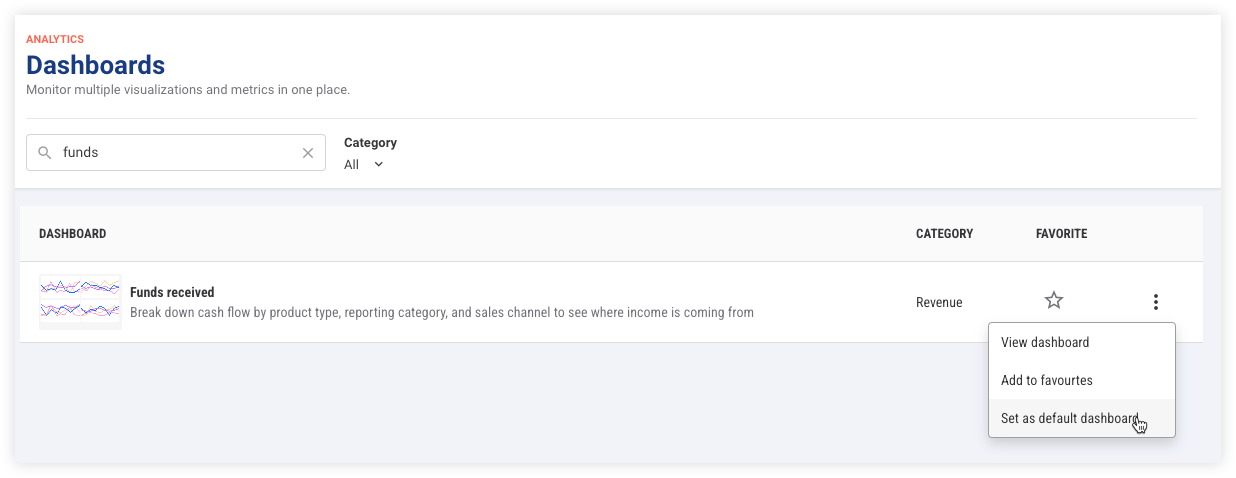
Or go to Analytics > Dashboards. A list of all dashboards appear. Select the options menu (3 dots) for the dashboard you want, then select Set as default dashboard.
View key terms
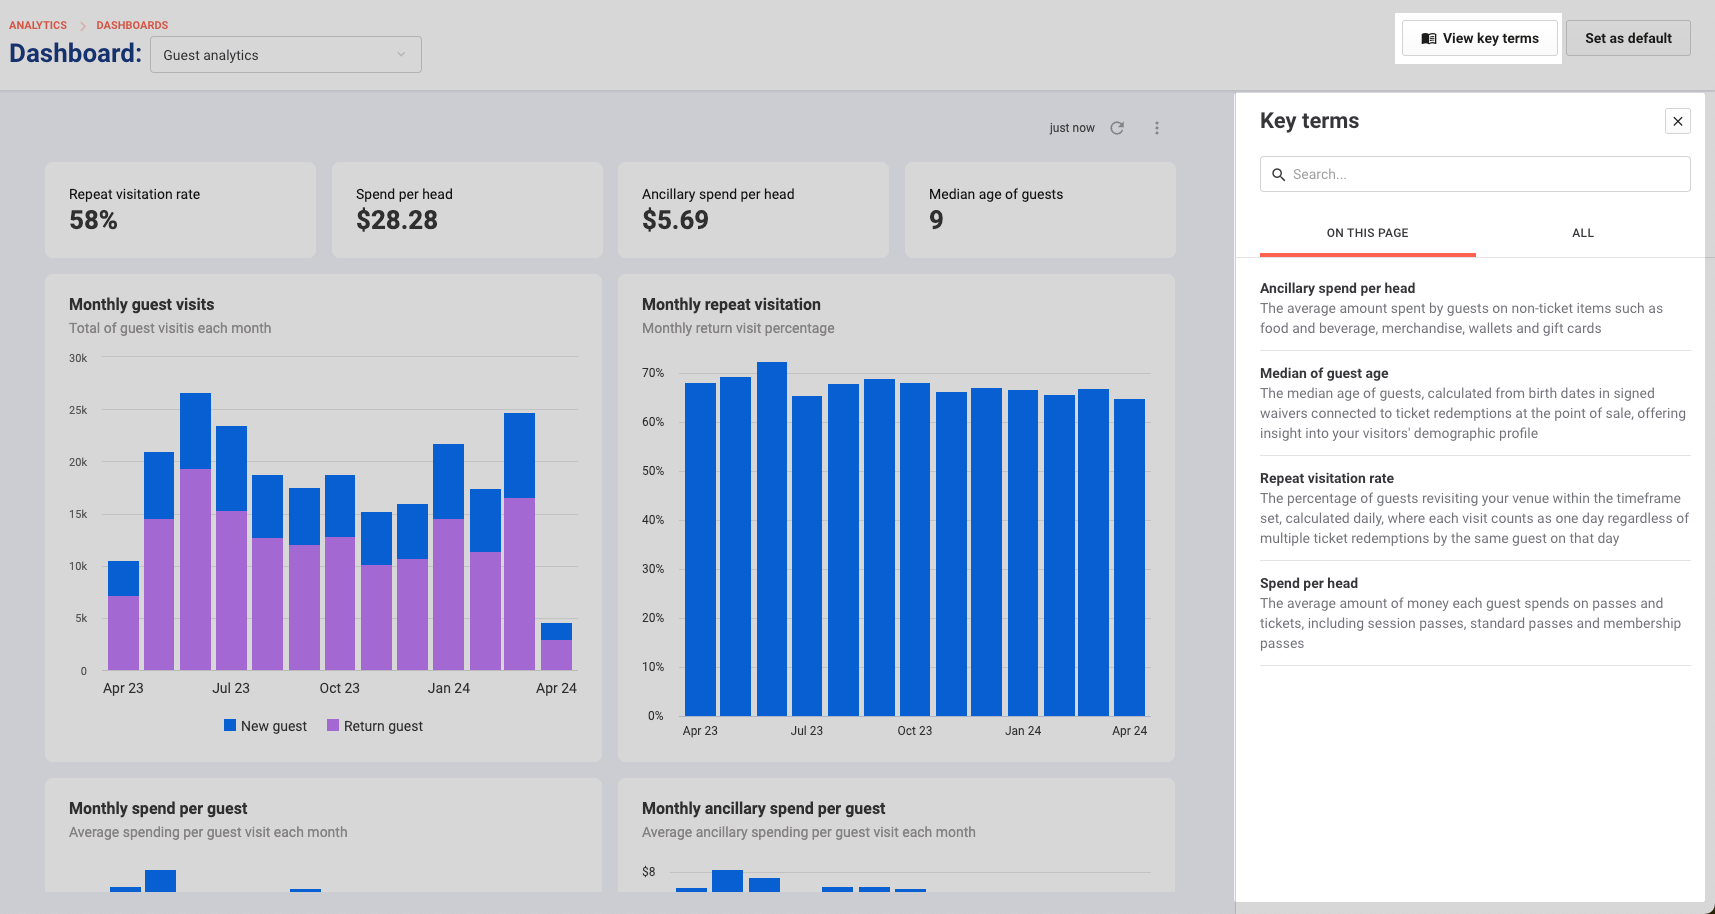
To accurately interpret the data, select the View key terms option located at the top right. This will open a searchable list of key metrics and terms, along with their definitions. These terms are relevant to the dashboard or report you're currently viewing.
Interact with the visualizations
You have multiple options to interact with the charts for more detailed or specific views.
Action | Effect |
|---|---|
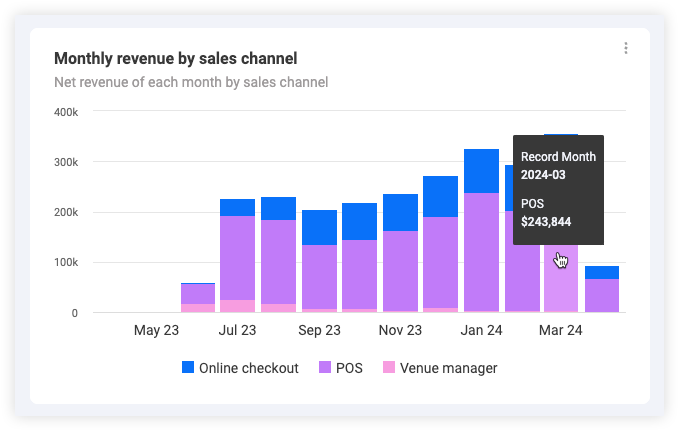
Move your cursor over specific data points | A tooltip appears, providing more detailed information about the data.
|
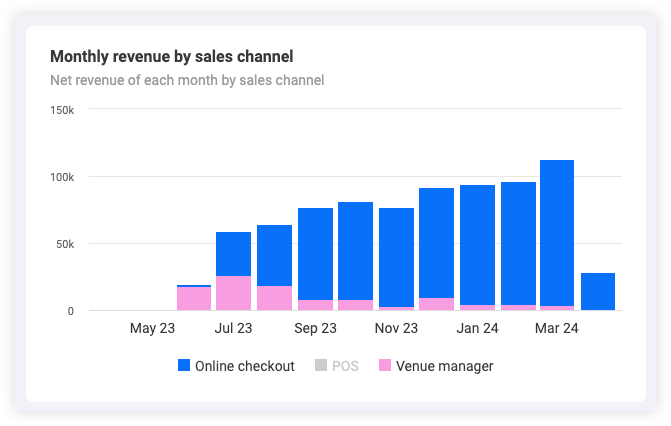
Select a data point in the legend of the chart | Temporarily removes the data point from the visualization, allowing for a more focused view of the data.
|
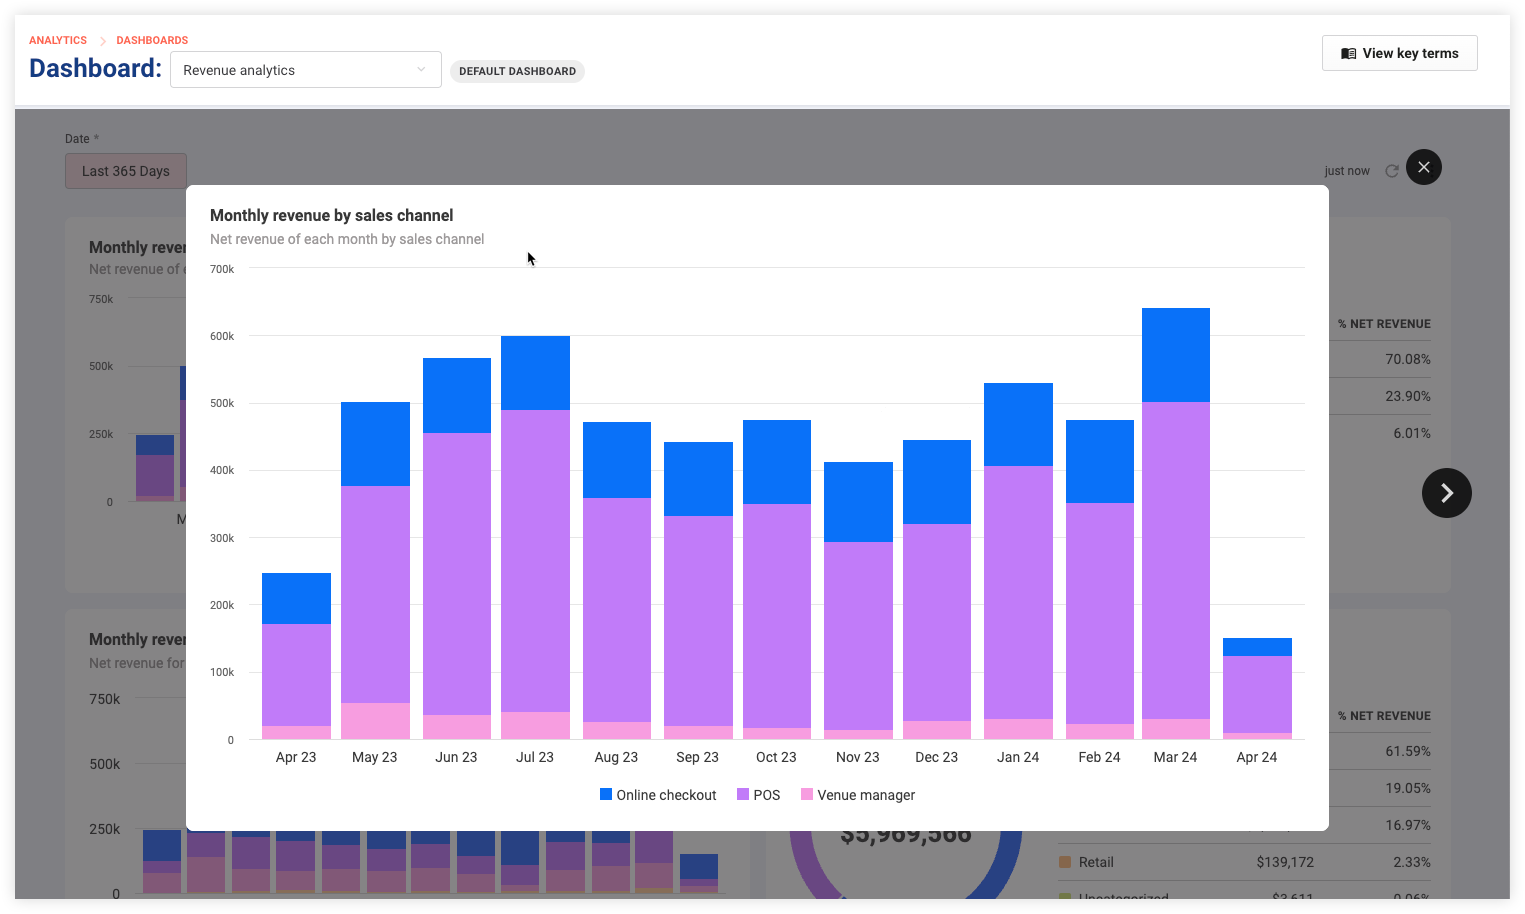
Expand a dashboard chart for a closer look |
|
Filter dashboards for specific time periods
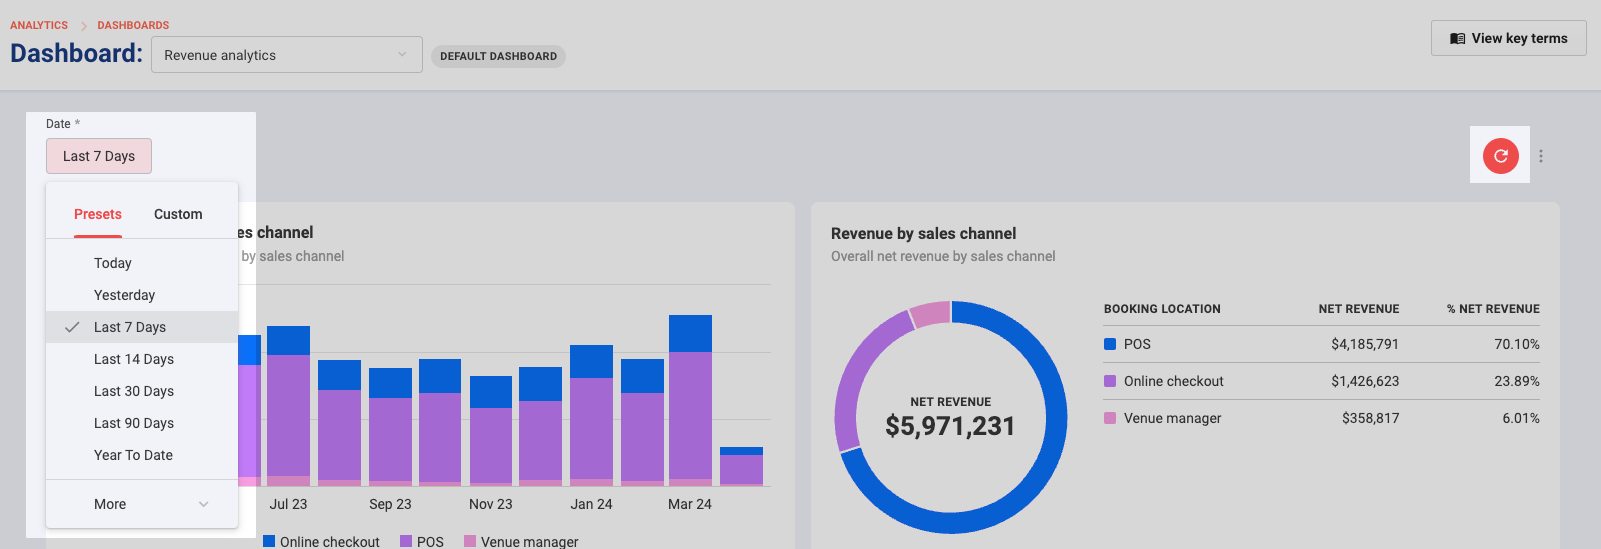
When a dashboard includes date filters, you can filter the data to show different timeframes, days, dates or date ranges. The date filters can be found at the top left of the dashboard page. Keep in mind that not all dashboards have date filters.
To choose a specific date or date range, use the drop-downs in the date filter. For example, you can select a preset filter such as "Last 7 Days" to only see results during that period.
Remember to select the highlighted Update icon to refresh the data and show the filtered results.
The next time you reload the dashboard, the default filters will return. Or select the options menu (3 dots) in the top right, then select Reset filters.
Modifying these filters will only temporarily affect your current view and will not affect the filter settings of other users.
Filter the report data
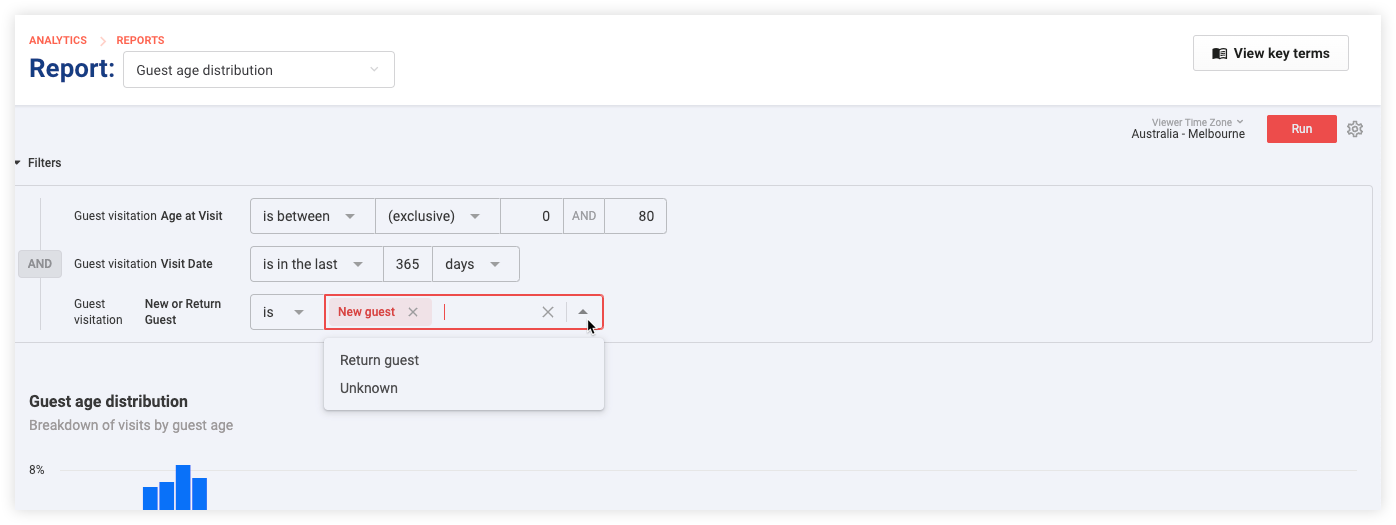
Each report provides various options for filtering the results based on time and other specific criteria. This lets you refine the results according to your requirements. For example, in the guest age distribution report, you can use filters to view results for either new guests or returning guests.
Select Filters to access a range of options for the current report.
Choose your desired timeframe, day, date or date range using the drop-downs, calendars or input fields.
For other filter criteria, select their drop-downs to choose preset values or input a value.
To remove a filter value, select the X to the right of the selected value.
After setting your filters, remember to select Run.
The report updates, displaying results according to your filters.
Remember, these filter settings are not permanent. When you reopen the report, it reverts to its default filters. To learn more about individual report filters, see the individual guide for the report.
 Download the dashboard and report data
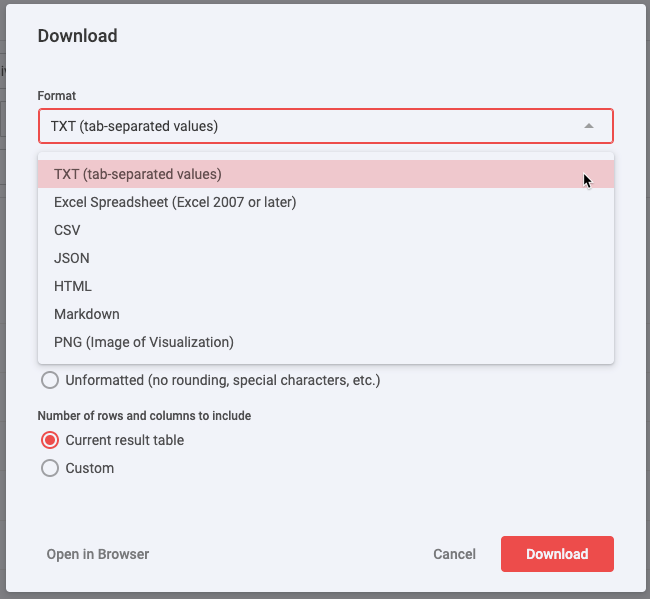
You have multiple options to download the data in a format you prefer, so you can review it in detail or share it with your team members.
What | How to download |
|---|---|
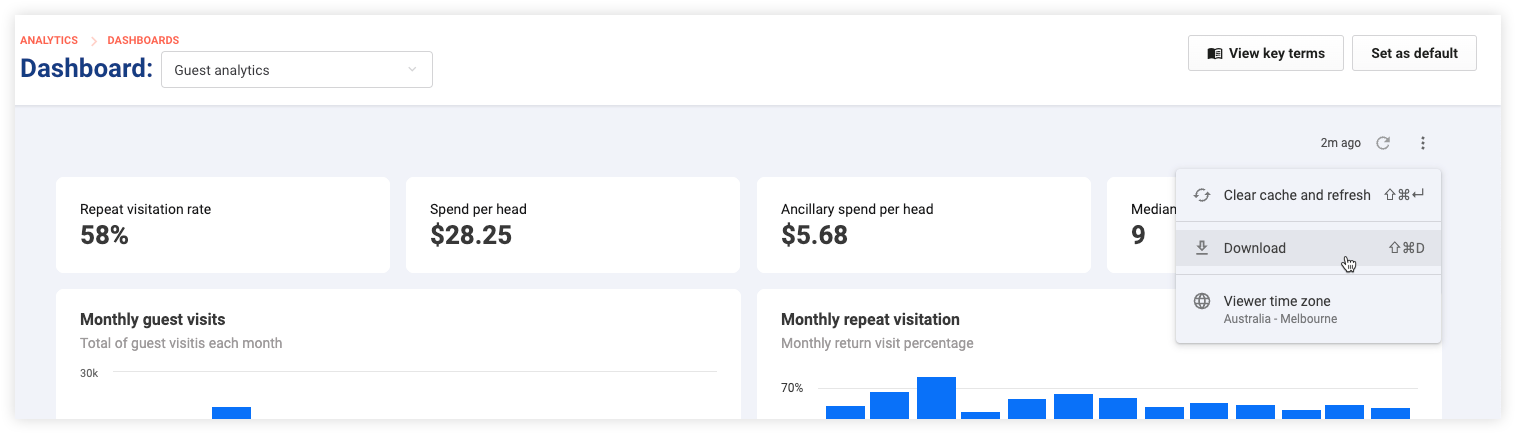
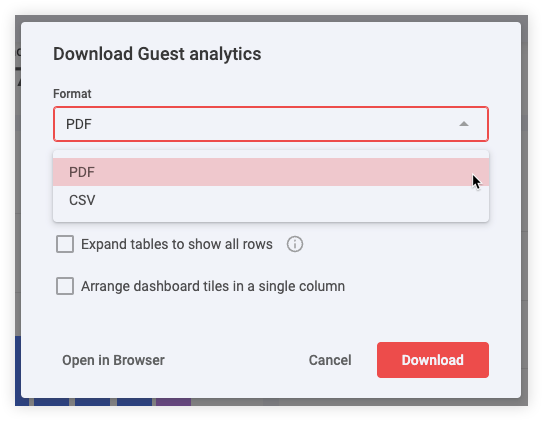
An entire dashboard |
|
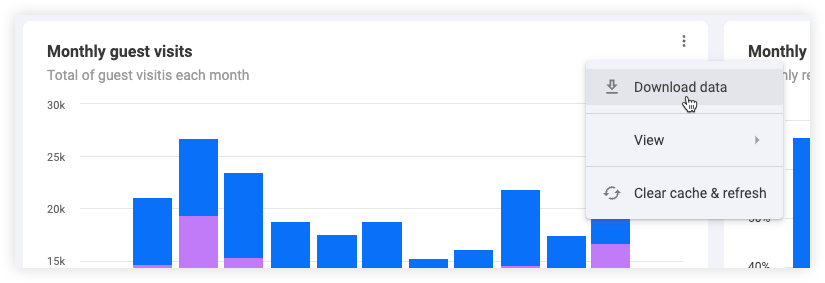
A specific dashboard metric or chart tile |
|
A report |
|
Favorite a dashboard or report
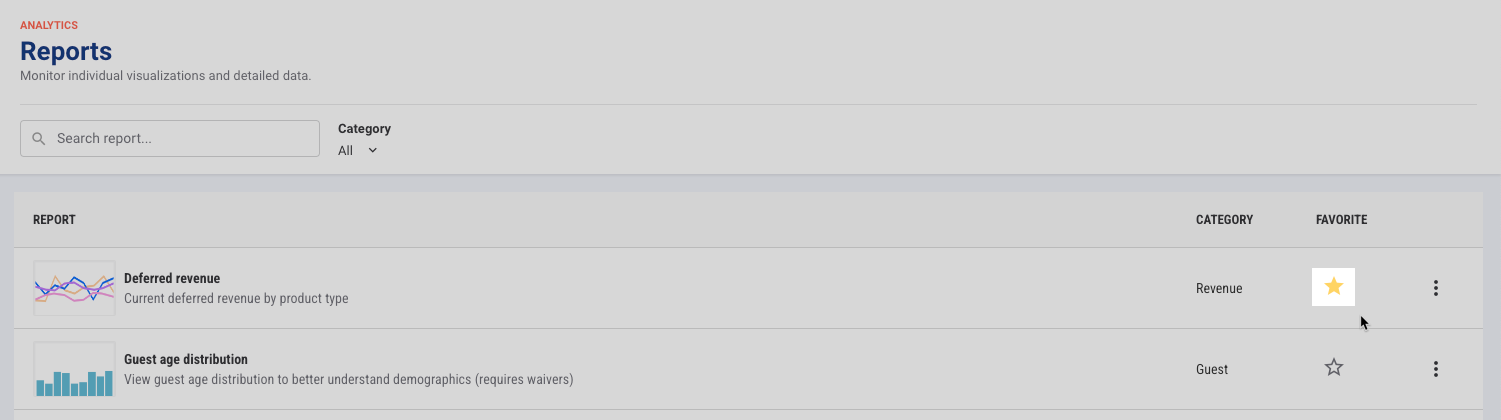
From Venue Manager, go to Analytics > Dashboards or Analytics > Reports.
Select the star icon for the dashboard or report you want.
This moves the dashboard or report to the top of the list.
More dashboard options
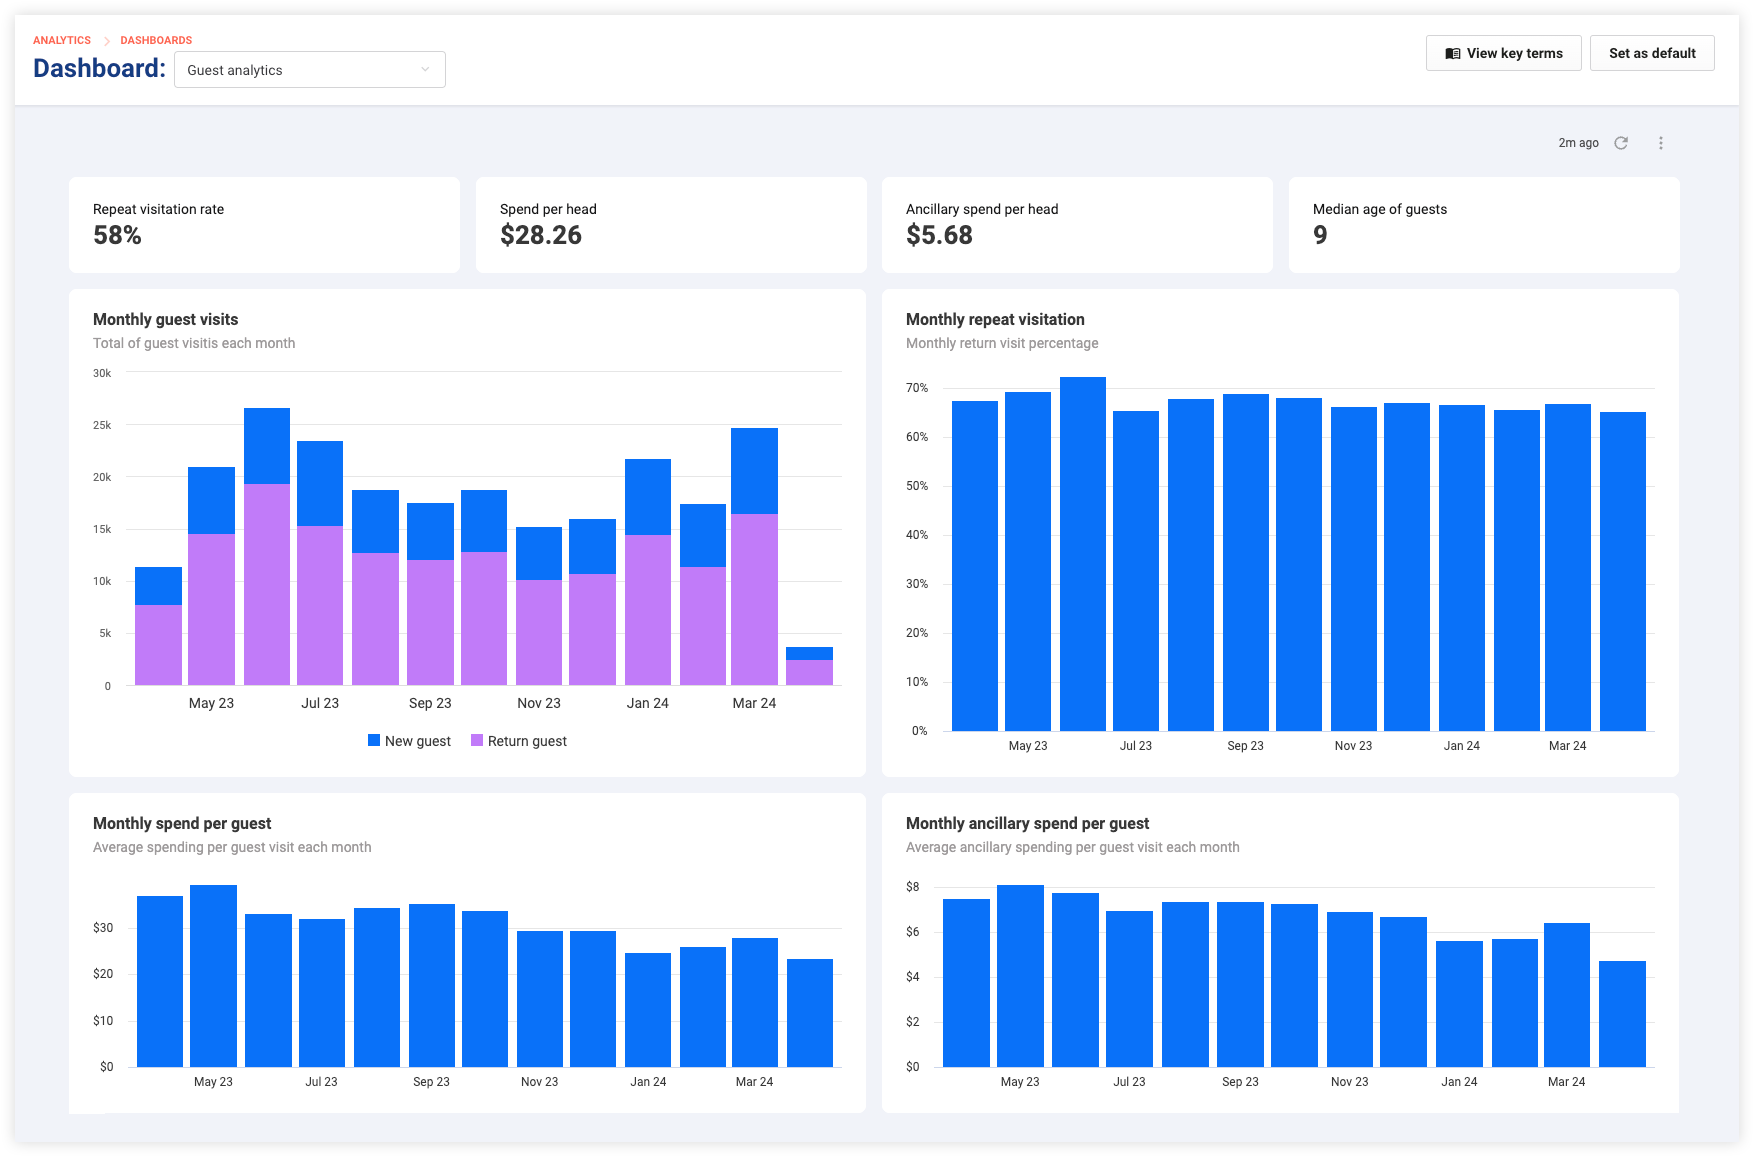
Dashboards include various additional elements that can help you.
Navigate around using the breadcrumbs menu
Find breadcrumb links at the top left of the dashboard. Select the Dashboards link to go to the dashboards page listing all dashboards, or the Analytics link to go to the default dashboard.
Quickly switch between dashboards
Use the drop-down menu at the top left of an open dashboard to switch between dashboards, categorized for ease of access (eg Guests, Memberships and Revenue).
Last updated indicator
This indicator appears at the top right of the dashboard and shows how recently the data on the dashboard has been refreshed.
Refreshing data manually in Analytics allows you to access the most up-to-date information. However, keep in mind that there is a delay of 90 minutes. This delay is caused by the time it takes for the data to transfer from ROLLER to Google BigQuery, and then to Looker for visualization.
Actions available for the entire dashboard
Select the dashboard options menu (3 dots) at the top right of a dashboard to access the following actions.
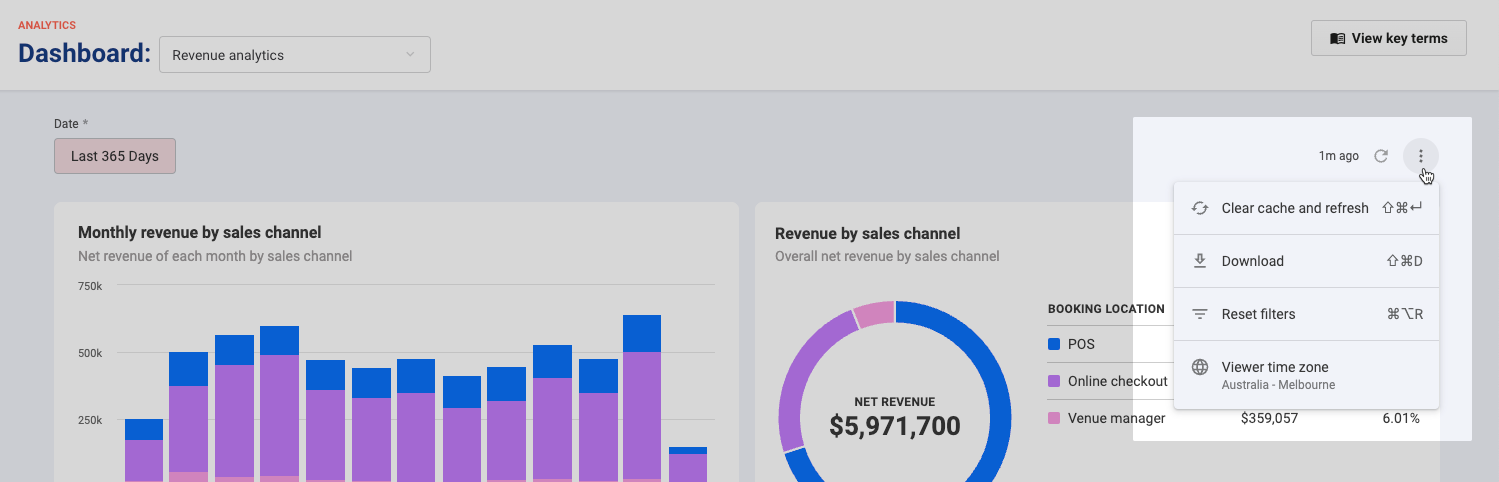
Action | Effect |
|---|---|
Clear cache and refresh | Clears the cache and refreshes all dashboard tiles to the latest available. Keep in mind the 90-minute latency in real-time data due to processing time. |
Download | Downloads the entire dashboard. A dialog box opens that allows you to select PDF or CSV as your download format. This option is useful for reviewing the data in detail or sharing it with team members. |
Reset filters | Reset all filters to their default settings. Filters must be present on the dashboard for the Reset filters option to be visible. |
Viewer timezone | Shows the current timezone configuration for your venue. You can select a different timezone to change it. The timezone setting affects the data that is returned when filtering for specific time periods such as "today" or "yesterday". |
Actions available for specific tiles
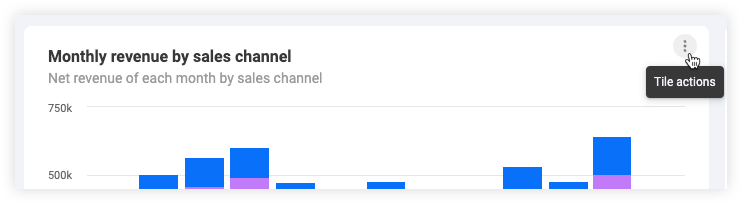
Hover over the top right of a tile, then select the options menu (3 dots) to choose from the following actions.
Actions | Effect |
|---|---|
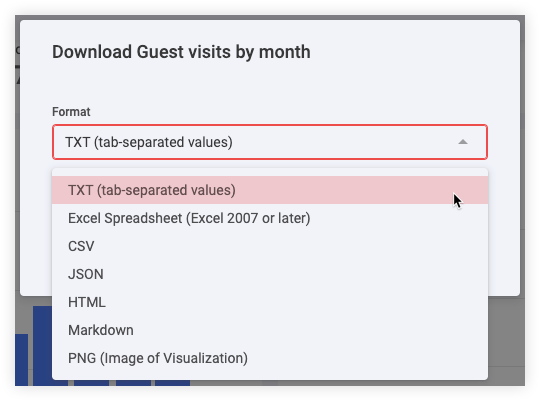
Download data | Downloads the data from a dashboard tile. This opens a dialog box with several formats and advanced options to choose from. |
View > Expanded | Opens an overlay over the dashboard, showing a bigger view of the chart. Use the forward or back arrows on the overlay to browse through each of the charts in the dashboard. |
More report options
Reports enable you to track and observe a single visualization, and they include similar components to dashboards.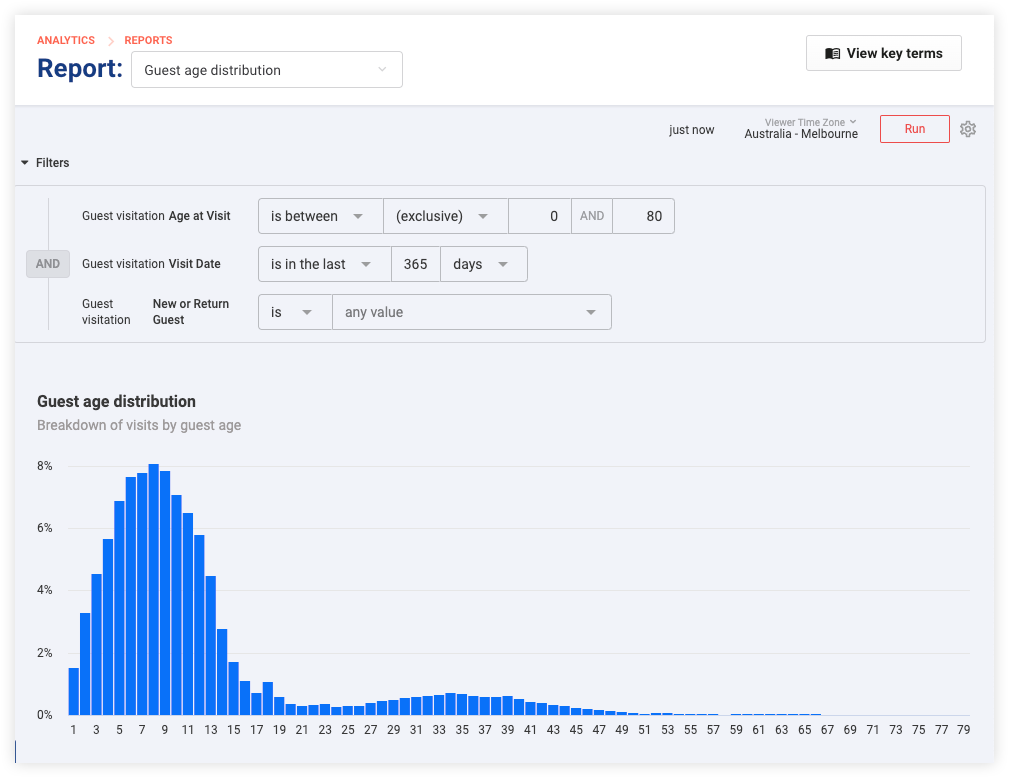
Navigate using breadcrumbs
Find breadcrumb links at the top left of the report. Select the Reports link to go to the Reports page or the Analytics link to go to the default dashboard.
Default timezone
The timezone displayed at the top right reflects the configuration for your venue. Select it to choose a different timezone.
The timezone setting impacts the data that is shown when filtering for time periods like "today" or "yesterday".
Report settings
Select the settings cog at the top right to complete the following actions.
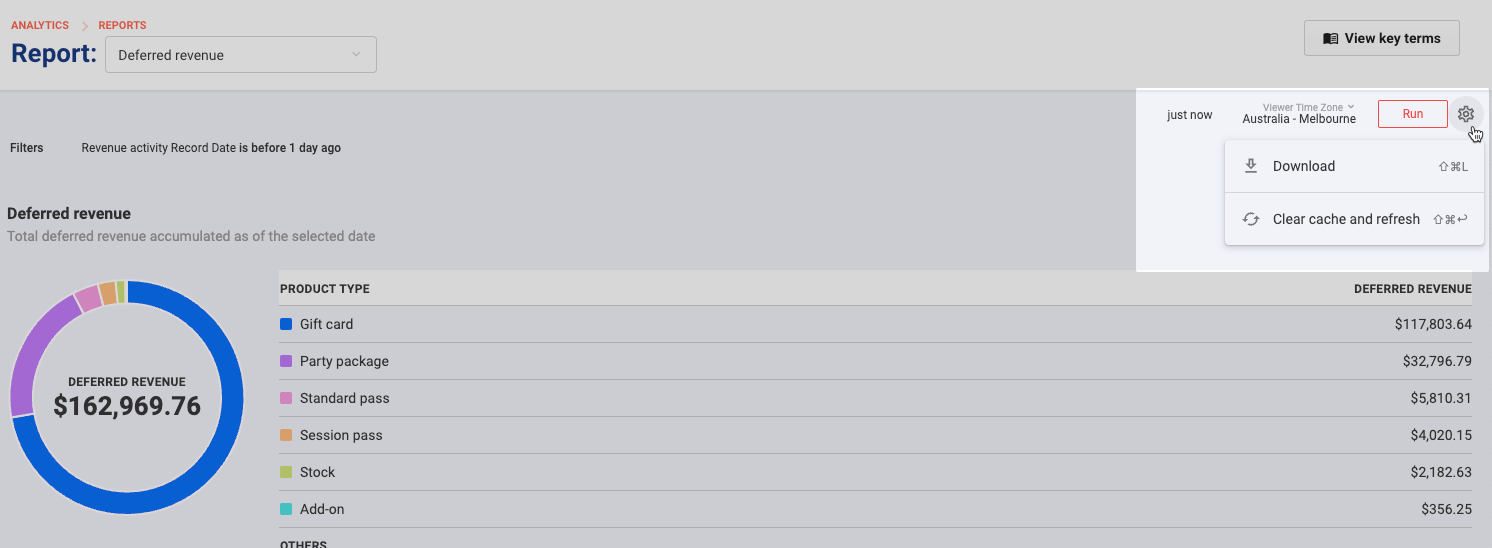
Action | Effect |
|---|---|
Download | Choose from a range of file formats and advanced options to download the data. This is useful if you want to look at the data more closely or need to share it with others. |
Clear cache and refresh the page | The last refresh time updates and refreshes the page. Keep in mind the 90-minute latency in real-time data due to processing time. |
No reset filters option is available. To return to default filters, you need to reload the report.