ROLLER Analytics is a powerful business intelligence tool, powered by Google, built directly into the ROLLER platform. It transforms your venue data into visual dashboards and reports, providing actionable insights to help grow your business.
This guide helps you get started with Analytics.
By leveraging business intelligence tools like ROLLER Analytics, businesses have reported saving up to 125 hours per year on data analysis and increasing operating income by up to 2.5% (Forrester).
Drive business growth
ROLLER Analytics provides you with the tools to monitor key business metrics, allowing you to quickly identify areas of success and opportunities for improvement.
Save time on manual data manipulation with simple visual reports and dashboards.
Boost revenue by tracking revenue growth, anticipating trends that will impact sales, and prioritizing changes to maximize profits.
Improve membership retention rates, conversion rates, visitation frequency and lifetime value while managing churn effectively.
Analyze guest purchase patterns and demographics to make informed decisions that improve the guest experience.
Access pre-built dashboards and reports
The permission Can access Analytics is required to view dashboards and reports. Administrator and manager system roles have this permission enabled by default and any custom roles based on these roles.
Analytics pre-built dashboards and reports are built directly into the platform, eliminating the need to export your ROLLER data to an external tool. Visual charts and graphs help you immediately understand trends, outliers and patterns in your venue data.
How to access
From Venue Manager, go to Analytics.
View, filter and interpret the pre-built dashboards and reports that are available.
The dashboards and reports you have access to depends on your plan. Read on to learn more.
Learn more about how to view, filter, download and interact with the dashboards and reports.
Which dashboards and reports do I have access to?
You have full access to all visual dashboards and reports listed below on all plans except Lite Legacy or Pro Legacy.
If you're on a Lite Legacy or Pro Legacy plan, reach out to your customer success manager or the support team to unlock the full range of Analytics dashboards and reports.
Visual dashboards
Dashboards allow you to monitor multiple visualizations of your data and metrics in a single location.
Explore the range of dashboards available. Select a dashboard link to learn more.
Guest
Dashboard | Key insights |
|---|---|
Guest preferences, demographics and spending habits to improve guest experiences and marketing strategies |
Memberships
Dashboard | Key insights |
|---|---|
Renewal rates, involuntary churn trends and membership cancelations to improve membership loyalty and retention | |
Fixed-cost membership growth, revenue and sales trends to improve membership retention and marketing | |
Recurring membership growth, revenue and new sales trends and billing changes to improve retention and revenue |
Overview
Dashboard | Key insights |
|---|---|
Holistic view of net revenue, guest visits, active memberships and party bookings over the years to improve overall business strategy and growth | |
Weekly performance by reviewing last week’s metrics and preparing for the week ahead with data on sales, guest counts, advance bookings and booking lead times. |
Parties & groups
Dashboard | Key insights |
|---|---|
Average party spend, booking trends, and popular booking days to optimize offerings and maximize revenue | |
Top performing party package products and sales channels from parties and events that have taken place | |
Recently created party package bookings by party package product, total booking values and sales channel |
Revenue
Dashboard | Key insights |
|---|---|
Cash flow by product type, reporting category, and sales channel to understand income sources | |
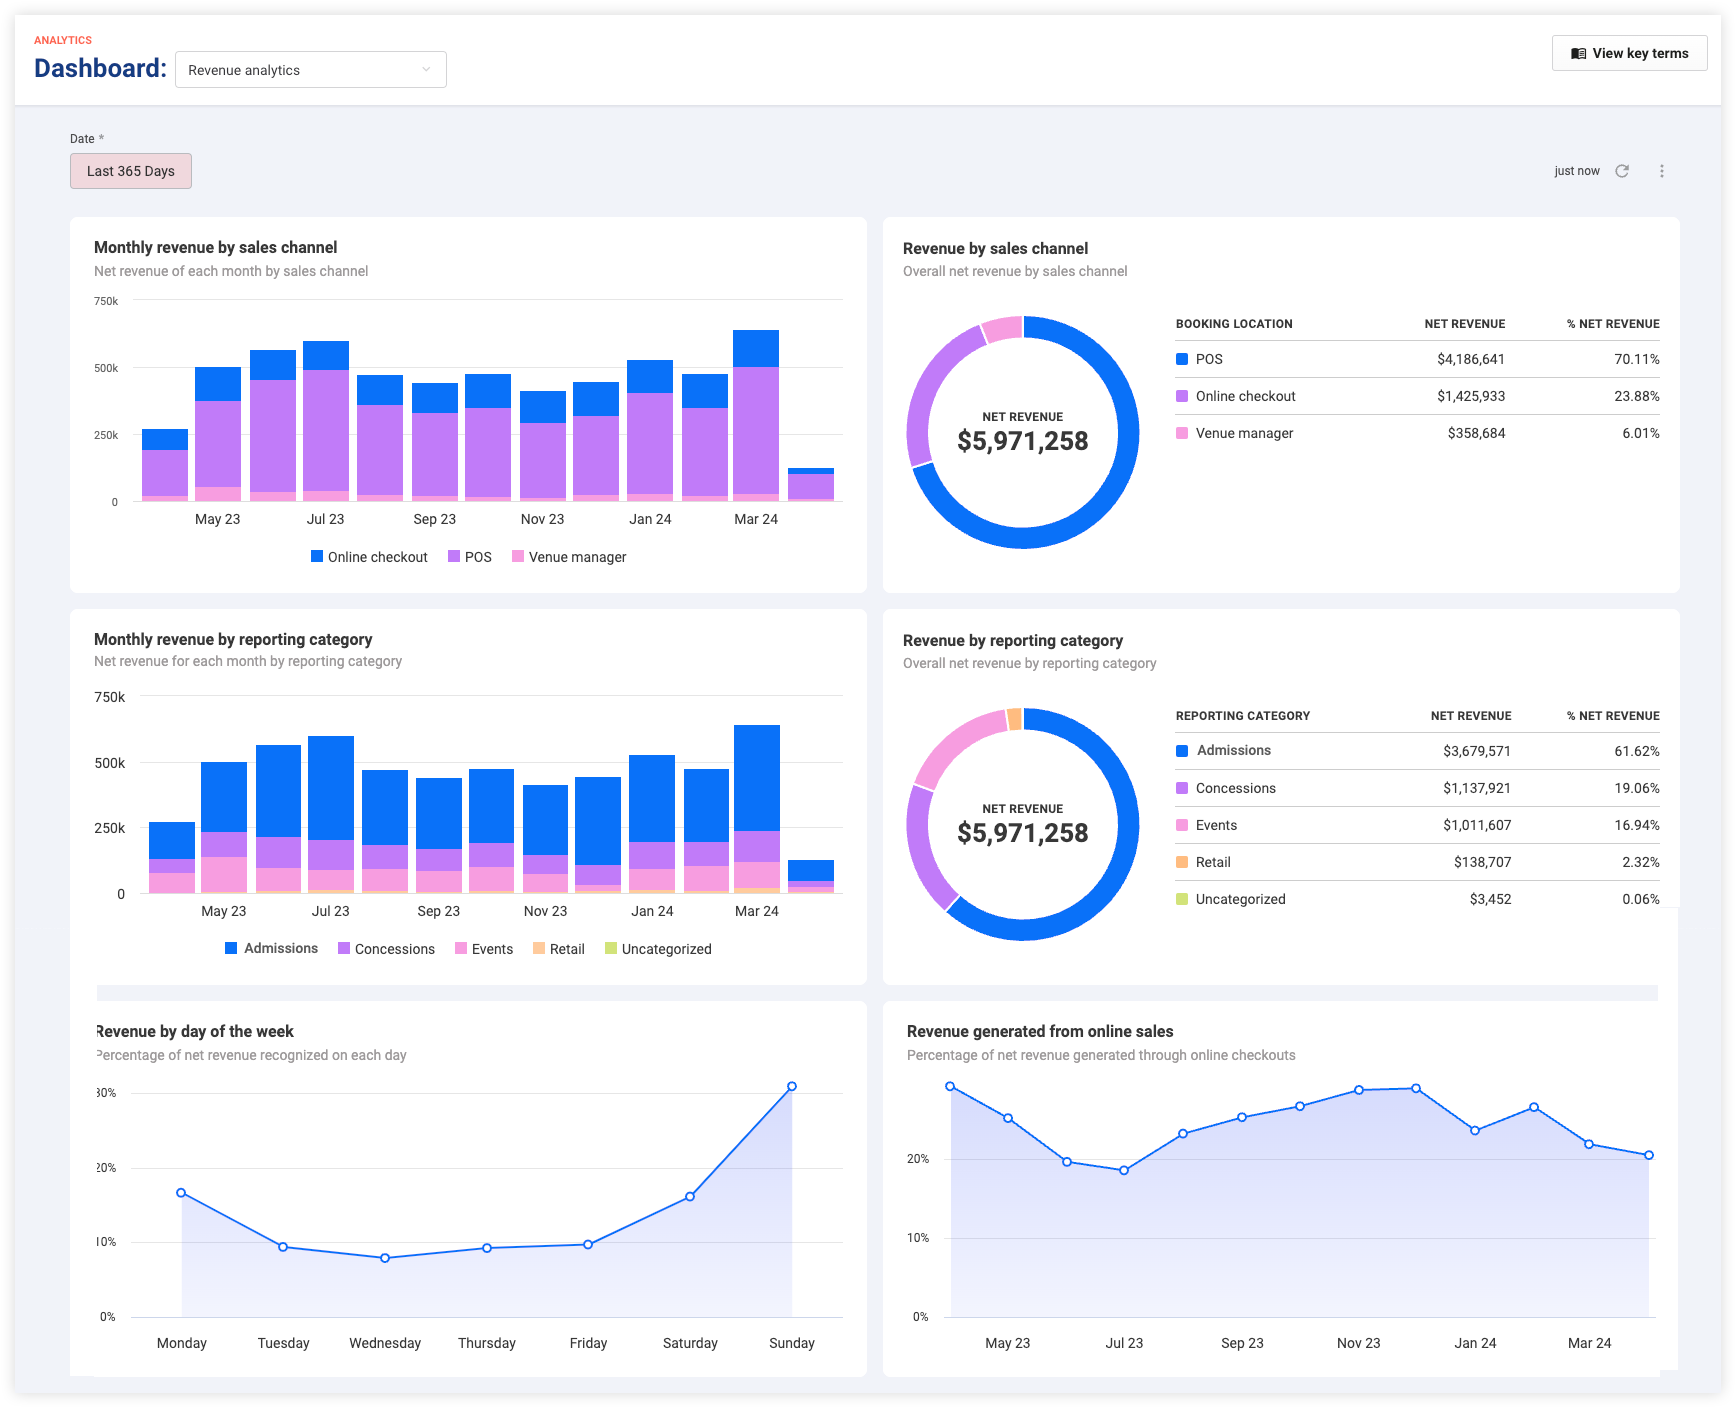
Monthly net revenue recognized by reporting category, sales channel, day of the week and the percentage of net revenue from online bookings (accrual accounting) | |
Online transaction values, including average online order size, bookings by month and monthly net revenue by product type | |
Individual staff member sales and overall sales distribution from POS and Venue Manager | |
Multi-passes sold and sessions redeemed by product to understand whether guests are returning to use the passes they bought |
Visual reports
Reports let you focus on single, detailed visualizations with more data and filters, giving you greater control over what you see and analyze.
Explore the range of reports available for each tier. Select a report link to learn more.
Guest
Report | Key insights |
|---|---|
Number of visits by guest age using the date of birth information collected in waivers |
Memberships
Report | Key insights |
|---|---|
Number of new members acquired for different membership products over time |
Parties and groups
Report | Key insights |
|---|---|
Monthly average price of party package tickets | |
Monthly average number of guests per party booking for party package products | |
Average amount of money spent by each guest at a party per month for your party package offerings | |
Monthly guest party spend on non-ticket items, such as snacks, food and beverage and merchandise, for party package bookings |
Revenue
Report | Key insights |
|---|---|
Current deferred revenue by product type, helping you understand future revenue potential | |
Top 25 discount codes used per booking item, sorted by usage and discounted amount | |
Total sales and discounts made by staff across sales channels and products | |
Monthly revenue for over the past three years, highlighting trends and changes | |
Net revenue generation by hour, helping you to identify peak and off-peak times of the day | |
Average online cart size per sales channel by month |
Why Analytics ignores reporting offsets (when configured)
Some venues use a reporting offset to group early morning transactions (past midnight) as part of the previous day’s standard grid reports. This helps align standard reports with the ROLLER Payments settlement period for the region, making it easier to reconcile payouts.
How the reporting offset works for standard reports (when configured)
By default, standard grid reports use the venue’s configured local time, so transactions made after midnight appear in the next day’s report. However, payouts from ROLLER Payments follow a fixed schedule based on the region’s timezone.
For example, a venue in Chicago (CST) may have payouts settled at midnight Pacific Time (PT) (regional), which is 2:00 AM CST. A 120-minute reporting offset moves these early-morning transactions back into the previous day’s ROLLER grid report, so that sales reports in ROLLER align with payouts for easier reconciliation.
Venues cannot configure the reporting offset themselves. It is typically set up during onboarding or adjusted by the support team if needed.
Why Analytics ignores the reporting offset
Analytics always displays figures based on the real date and time they occurred.
This provides accurate sales (funds received) and net revenue trends, guest behavior insights and performance tracking.
Analytics is designed for business decisions, not payout reconciliation, so it does not shift transactions into a different reporting day.
Impact on reporting comparisons
If your venue uses a reporting offset, total values in a ROLLER grid report may not match Analytics for the same day.
This is expected. Standard grid reports align with payouts when a reporting offset is used, while Analytics provides a true picture of when sales actually happened and when net revenue was recognized.
FAQs
How does ROLLER Analytics integrate with Google BigQuery and Looker?
ROLLER Analytics leverages Google BigQuery for data processing and Looker for creating insightful dashboards and reports, enabling near real-time monitoring within ROLLER.
What’s the difference between ROLLER Analytics and standard grid reports?
Analytics provides visual data representation and strategic insights, unlike standard grid reports, which focus on line-by-line transactions and retrospective operational, sales, and financial data. Analytics doesn’t replace standard grid reports; instead, they complement each other — Analytics helps identify trends and opportunities, while standard reports provide detailed transaction records for reconciliation and operational tracking.
Can I drill into the data with Analytics or create my own reports?
While creating custom reports is not supported, Analytics offers pre-built dashboards and reports with options for filtering, downloading, and interacting with data. Learn more
What’s the difference between Analytics dashboards and Analytics reports?
Dashboards: Consolidate various metrics and visualizations for trend tracking.
Reports: Offer in-depth analysis of specific visualizations with additional filters.
How often is the data updated in Analytics?
Analytics data updates approximately every 90 minutes. This is due to the time it takes for data to travel from ROLLER's core database to the reporting database, then to BigQuery and finally to Looker.
Are the accounting principles and terms used the same as standard reporting?
ROLLER Analytics follows the same accounting principles and data structure as standard ROLLER reporting. Additionally, it introduces new metrics and terms like guest visitation, guest spend and ancillary spend on extras such as snacks, concessions and upsell items.
To help you understand terms, we have included a key terms tool in ROLLER. You can access it from the dashboard for the report you are viewing.
Why do standard grid reports and Analytics show different totals for the same day?
Standard grid reports may use a reporting offset to move early-morning transactions (past midnight) into the previous day’s report so sales reports align with ROLLER Payments payouts. However, Analytics always displays values based on the actual date and time they occurred, without adjustments.
Why does Analytics ignore any configured reporting offset?
Analytics is designed for business insights, not payout reconciliation. It shows true sales trends, guest behavior insights, and net revenue based on actual transaction times, ensuring accurate reporting for decision-making.
Learn more
Learn how to view, filter, interact with and download the reports and dashboards.