Use this dashboard to better understand your venue's financial data. It visualizes your net revenue, breaking it down by sales channels, product types, reporting categories and online sales channel. It helps you see how your venue is performing financially, and make strategic decisions to drive business growth.
This dashboard is the default dashboard for all venues, and is based on the accrual method of accounting. If you're using the cash accounting method, see the guide Funds received dashboard in Analytics and how to set it as the default dashboard.
Questions answered
How is revenue distributed across our different sales channels?
Which products or services are our biggest revenue drivers?
What are the trends in our revenue by reporting category?
How do customer payment preferences impact our revenue?
On which days of the week do we see the highest revenue?
Revenue in this dashboard shows net revenue, which is recognized revenue after tax taken out for the the last 365 days (default timeframe). In ROLLER, net revenue is typically recorded when guests redeem their tickets at POS or booking items expire, in line with accrual accounting. Learn more
Actionable insights
Evaluate the performance of each sales channel to optimize your sales strategy.
Focus on high-performing product lines and consider strategies for underperforming categories.
Gain insights into which reporting categories are contributing most to your revenue and why.
Leverage insights on daily revenue trends to plan promotions and staffing.
Access the report
The permission Can access Analytics is required to view dashboards and reports. Administrator and manager system roles have this permission enabled by default.
From Venue Manager, go to Analytics > Reports.
Search for and select Revenue analytics.
Dashboard metrics and calculations
Review the metrics and data shown in the dashboard, then consult the table below to understand how they are defined and calculated.
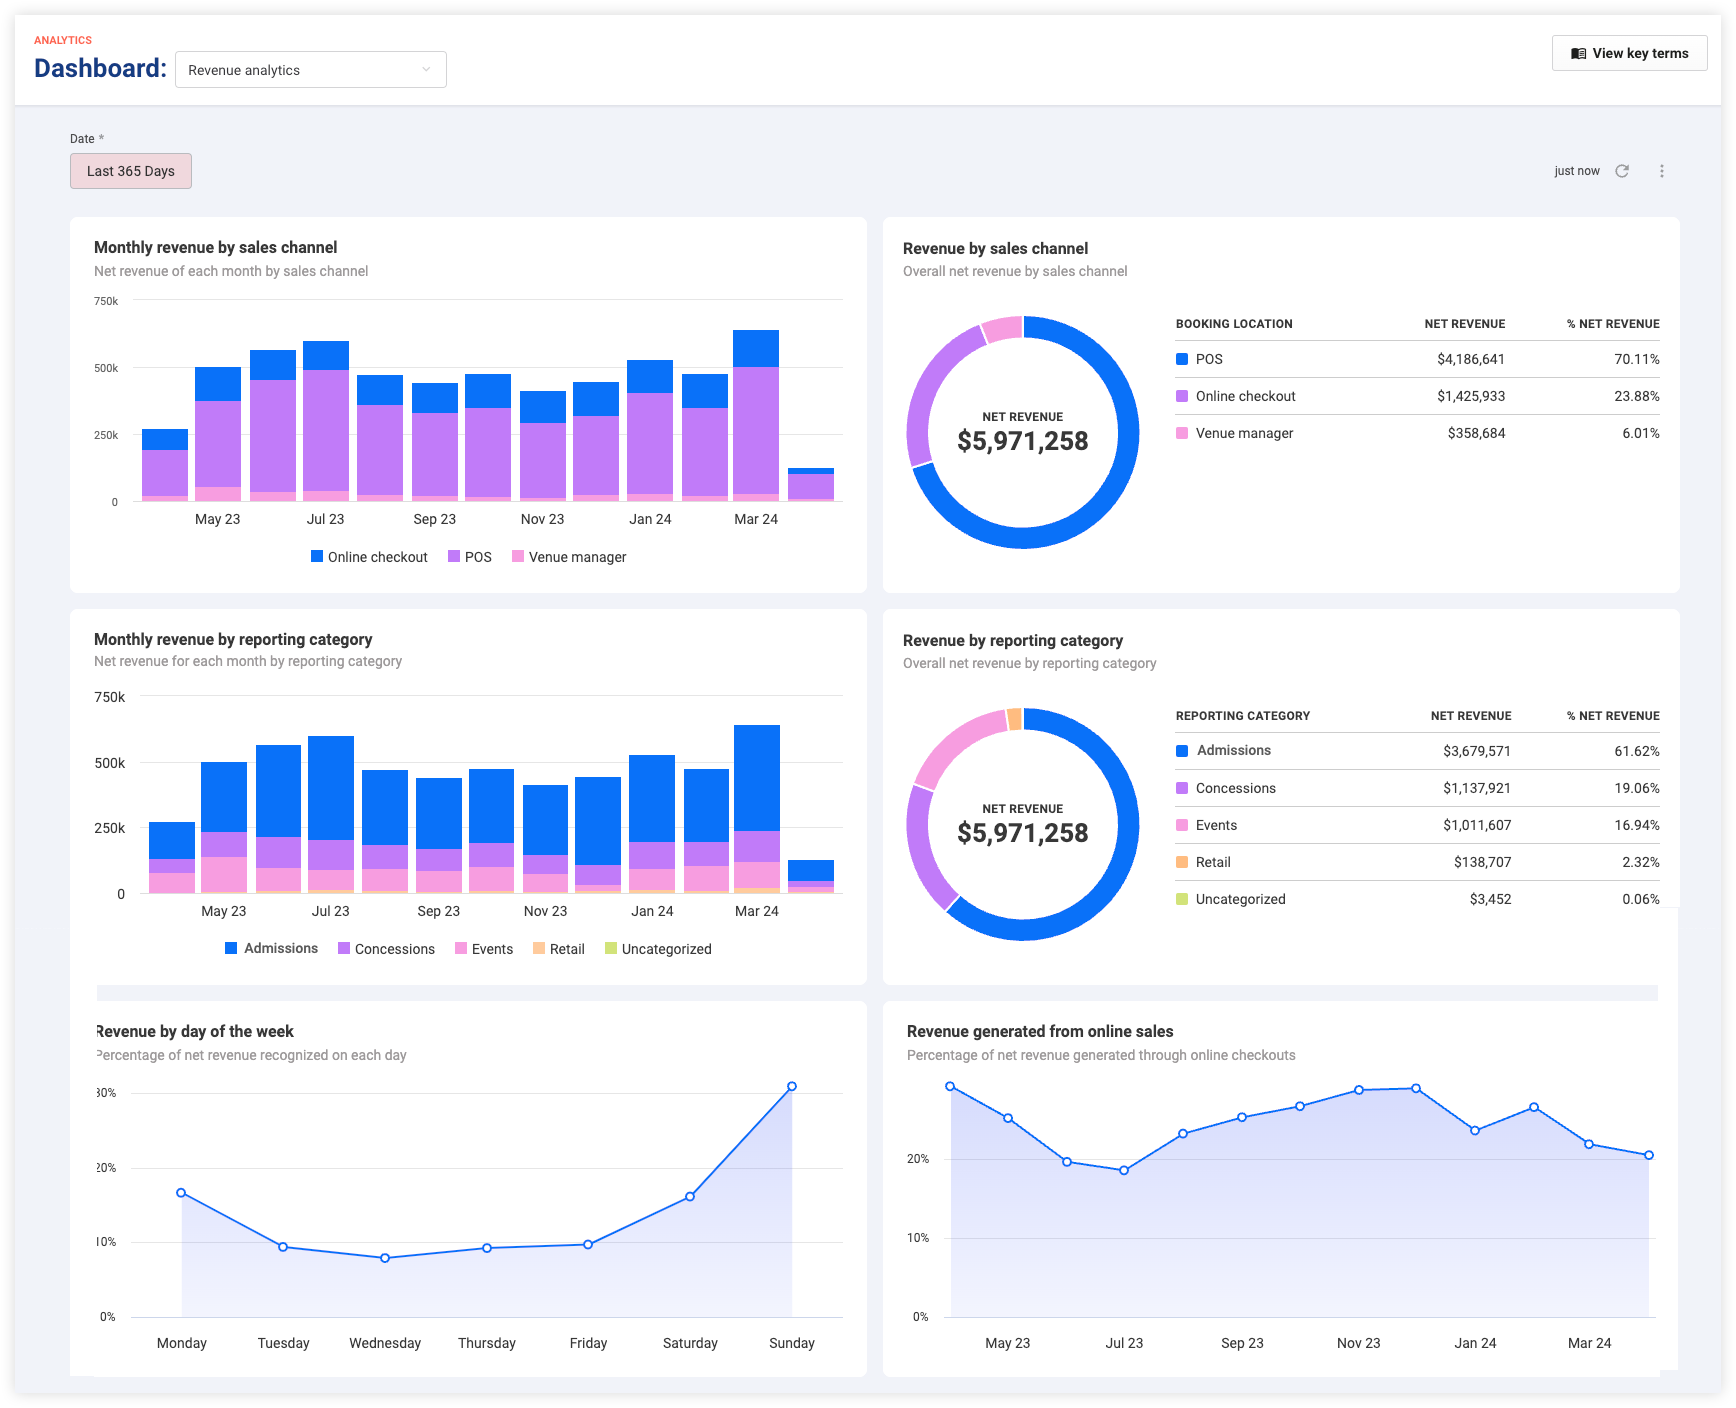
Net revenue is total revenue recognized after taxes have been deducted, in line with accrual accounting.
Metric | Definition / calculation |
|---|---|
Monthly revenue by sales channel |
|
Revenue by sales channel | A pie chart detailing the percentage of total net revenue from each sales channel (booking location). |
Monthly revenue by reporting category | A bar chart displaying monthly net revenue by reporting categories. Reporting categories are the names you've assigned in Venue Manager to group products for reporting, linked to specific general ledger (GL) codes. |
Revenue by reporting category | A pie chart breaking down overall net revenue by different reporting categories. |
Revenue by day of the week | A line chart showing the percentage of net revenue recognized on each day of the week. |
Revenue generated from online sales | A line chart tracking the percentage of the total value of net revenue from bookings that initiated from the online checkout sales channel. |
Filter the timeframe
The dashboard defaults to the last 365 days, but you can customize the date range to focus on specific periods that are most relevant to your requirements.
To choose a timeframe, use the Date filter at the top left of the page. It allows you to select preset days and timeframes, or specify custom dates and date ranges.
Remember to select the highlighted Update icon to refresh the data.
Your filtered results display.
Modifying these filters will only temporarily affect your current view and will not affect the filter settings of other users.
The next time you load the dashboard the default filters will return.
Or, you can select the options menu in the top right to select Refresh filters.
Find out more about how to filter for specific timeframes, interact with and download the data in dashboards.
FAQs
Why do net revenue figures for online sales differ between dashboards?
The Online checkout revenue dashboard only includes payments made online (eg party deposits), excluding payments made later at POS. It measures average online order size for products purchased online.
The Revenue analytics dashboard includes the total booking value of transactions initiated via the online checkout sales channel, even if the remaining payments were completed in other sales channels.
This is why figures may not match when comparing the same month.