This report compares net revenue results for each month over a three-year span. It helps you see trends at a glance, evaluate strategic impacts and plan future growth.
All plans except Lite Legacy or Pro Legacy plans
To unlock this report, reach out to your customer success manager or our support team for help.
Questions answered
How does the revenue for the current month compare to the same month in previous years?
What seasonal trends can be observed in the revenue data over the past three years?
Which months have experienced the most significant growth or decline in revenue year-over-year?
How have external factors potentially influenced revenue trends during the analyzed period?
This report is relevant if you're using the accrual accounting method to manage your books, where net revenue (gross revenue minus tax payable) is recognized when it's earned, rather than at the time of purchase. In ROLLER, this is typically when guests redeem their tickets at POS or bookings expire. Learn more
Actionable insights
Identify long-term revenue trends and patterns.
Evaluate the success of business strategies implemented over the past three years.
Inform financial projections and strategic planning for upcoming years.
Access the report
The permission Can access Analytics is required to view dashboards and reports. Administrator and manager system roles have this permission enabled by default.
From Venue Manager, go to Analytics > Reports.
Search for and select Monthly revenue year-over-year.
Interpret the visualization
The report features a bar chart that displays net revenue for each month by year, with different colors representing each year for easy comparison.
Regularly monitor this report to quickly see monthly and yearly net revenue trends and make year-over-year comparisons.
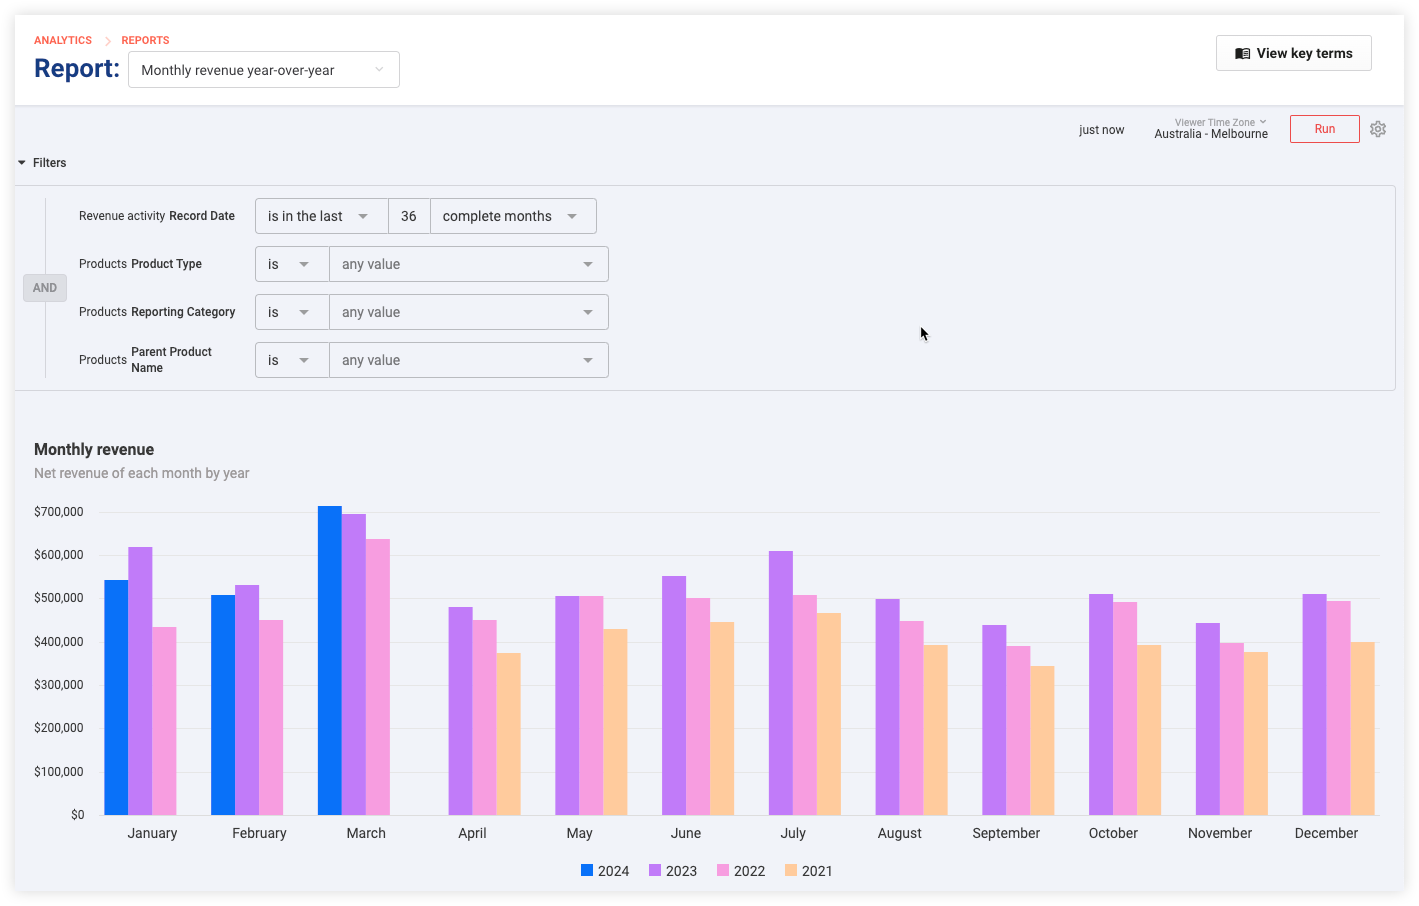
While the report defaults to the past 36 complete months, you can customize the date range or other parameters to focus on specific data segments.
Select Filters at the top left of the report page to reveal the filters.
Review and understand the default filters currently applied.
Modify the filters using drop-down menus, calendars and entry fields.
Remove filter values by selecting the X to the right of a selected item.
Select Run to update the report with the new filters.
Any changes to filters are temporary and will revert back to default upon reopening the report.
Filter | Options |
|---|---|
Record Date |
|
Product Type | Initially includes all product types; use the drop-down to filter on specific product types. |
Reporting Category |
|
Parent Product Name |
|
Learn more about how you can filter, interact with and download the data in reports.
FAQ
What is the purpose of the this report?
This report is designed to help you understand net revenue evolution monthly over a three-year period, compared to this year, highlighting growth trends and the impact of business decisions on revenue.
How can this report assist in financial planning?
By revealing net revenue patterns and trends, the report provides a solid foundation for forecasting and setting realistic financial goals for the upcoming year.
Can this report help in identifying the impact of seasonal promotions?
Yes, by comparing net revenue across the same months in different years, you can gauge the effectiveness of seasonal promotions and other marketing efforts.
Is it possible to customize this report for a different timeframe?
While the default is set to 36 complete months, you can adjust the filters to analyze a different period as needed for your specific analysis requirements.