This report provides a visual representation of revenue distribution across different hours of the day. It is designed to help identify peak revenue periods and understand guest activity patterns on an hourly basis.
All plans except Lite Legacy or Pro Legacy plans
To unlock this report, reach out to your customer success manager or our support team for help.
Questions answered
What are the peak revenue hours in a typical day?
When is revenue generation the lowest?
How does revenue vary from early morning to late evening?
The report calculates the percentage of revenue by hour based on net revenue, which is income after taxes. It accounts for revenue recorded at the time of service delivery, which in ROLLER is typically when purchased tickets are redeemed at POS, or booking items expire, in line with accrual accounting principles. Learn more
Actionable insights
Pinpoint times when guests are most active to better target operations and marketing.
Align staffing and operating hours with demonstrated revenue trends for efficiency.
Compare hourly revenue across different days and/or sales channels.
Access the report
The permission Can access Analytics is required to view dashboards and reports. Administrator and manager system roles have this permission enabled by default.
From Venue Manager, go to Analytics > Reports.
Search for and select Revenue by hour of the day.
Interpret the visualization
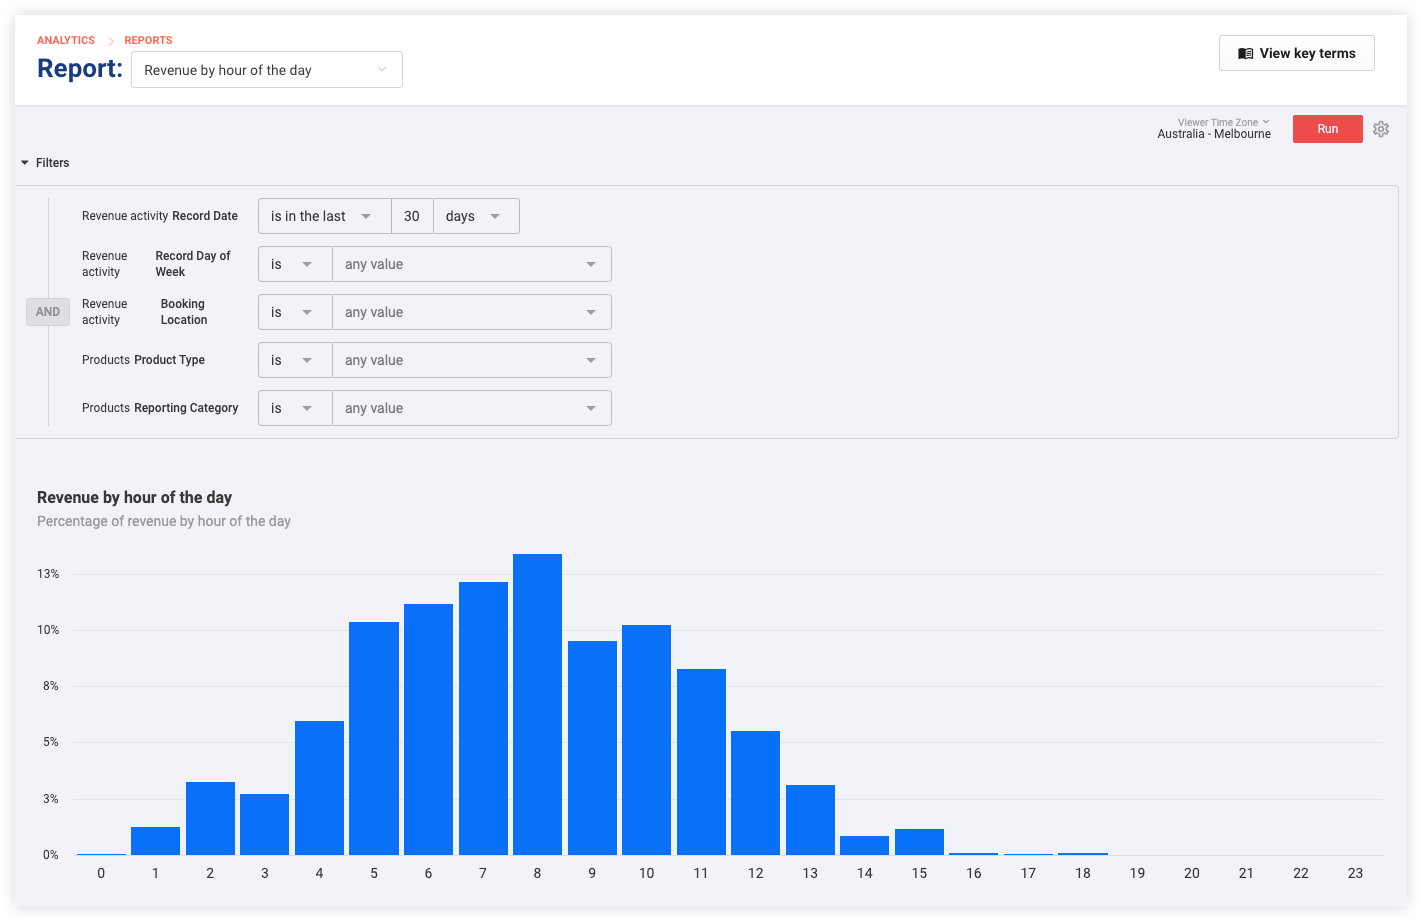
The bar graph in the report illustrates the percentage of total daily revenue earned during each hour.
The x-axis represents the hours of the day, while the y-axis shows the percentage of revenue.
The tallest bars indicate the hours with the highest revenue recorded, providing a clear visual indicator of peak times of when guests visit the venue and redeem purchased tickets at POS.
Regularly monitor this report to optimize operations and marketing by aligning them with patterns in guest activity and revenue trends.
Filter the report
The report comes with pre-set filters that can be customized for a more focused analysis.
Select Filters at the top left of the report page.
Review and understand the default filters currently applied.
Modify the filters using drop-down menus, calendars and entry fields.
Remove filter values by selecting the X to the right of a selected item.
Select Run to update the report with the new filters.
Any changes to filters are temporary and will revert back to default upon reopening the report.
Filter | Options |
|---|---|
Record Date | Default set to the last 30 days. Adjust the date range as needed. |
Day of Week | Default includes all days of the week. Use the filters to focus analysis on specific days. |
Booking Location | Default includes all sales channels. Filter by online checkout, POS, or Venue Manager. |
Product Type | Default includes all product types. Analyze revenue by hour by different product types. |
Learn more about how you can filter, interact with and download the data in reports.