Monitor your venue's monthly net revenue, guest visits, membership trends and party or group booking trends all from one location with this dashboard. Easily compare your venue's performance on a year-over-year basis at a glance.
All plans except Lite Legacy and Pro Legacy plans
To unlock this dashboard, reach out to your customer success manager or our support team for help.
Top insights
How does our monthly net revenue compare to the same months in previous years?
Are we getting more guest visits each month compared to the same months in previous years?
What are the current numbers and trends in our membership base?
How much revenue do we generate from membership and party package products?
The figures on this dashboard display net revenue, which is the earnings after taxes are deducted. In ROLLER, net revenue is typically recorded when guests redeem tickets at POS, or booking items expire, in line with accrual accounting principles. Learn more
Access the dashboard
The permission Can access Analytics is required to view dashboards and reports. Administrator and manager system roles have this permission enabled by default.
From Venue Manager, go to Analytics > Dashboards.
Search for and select Venue performance.
Dashboard overview
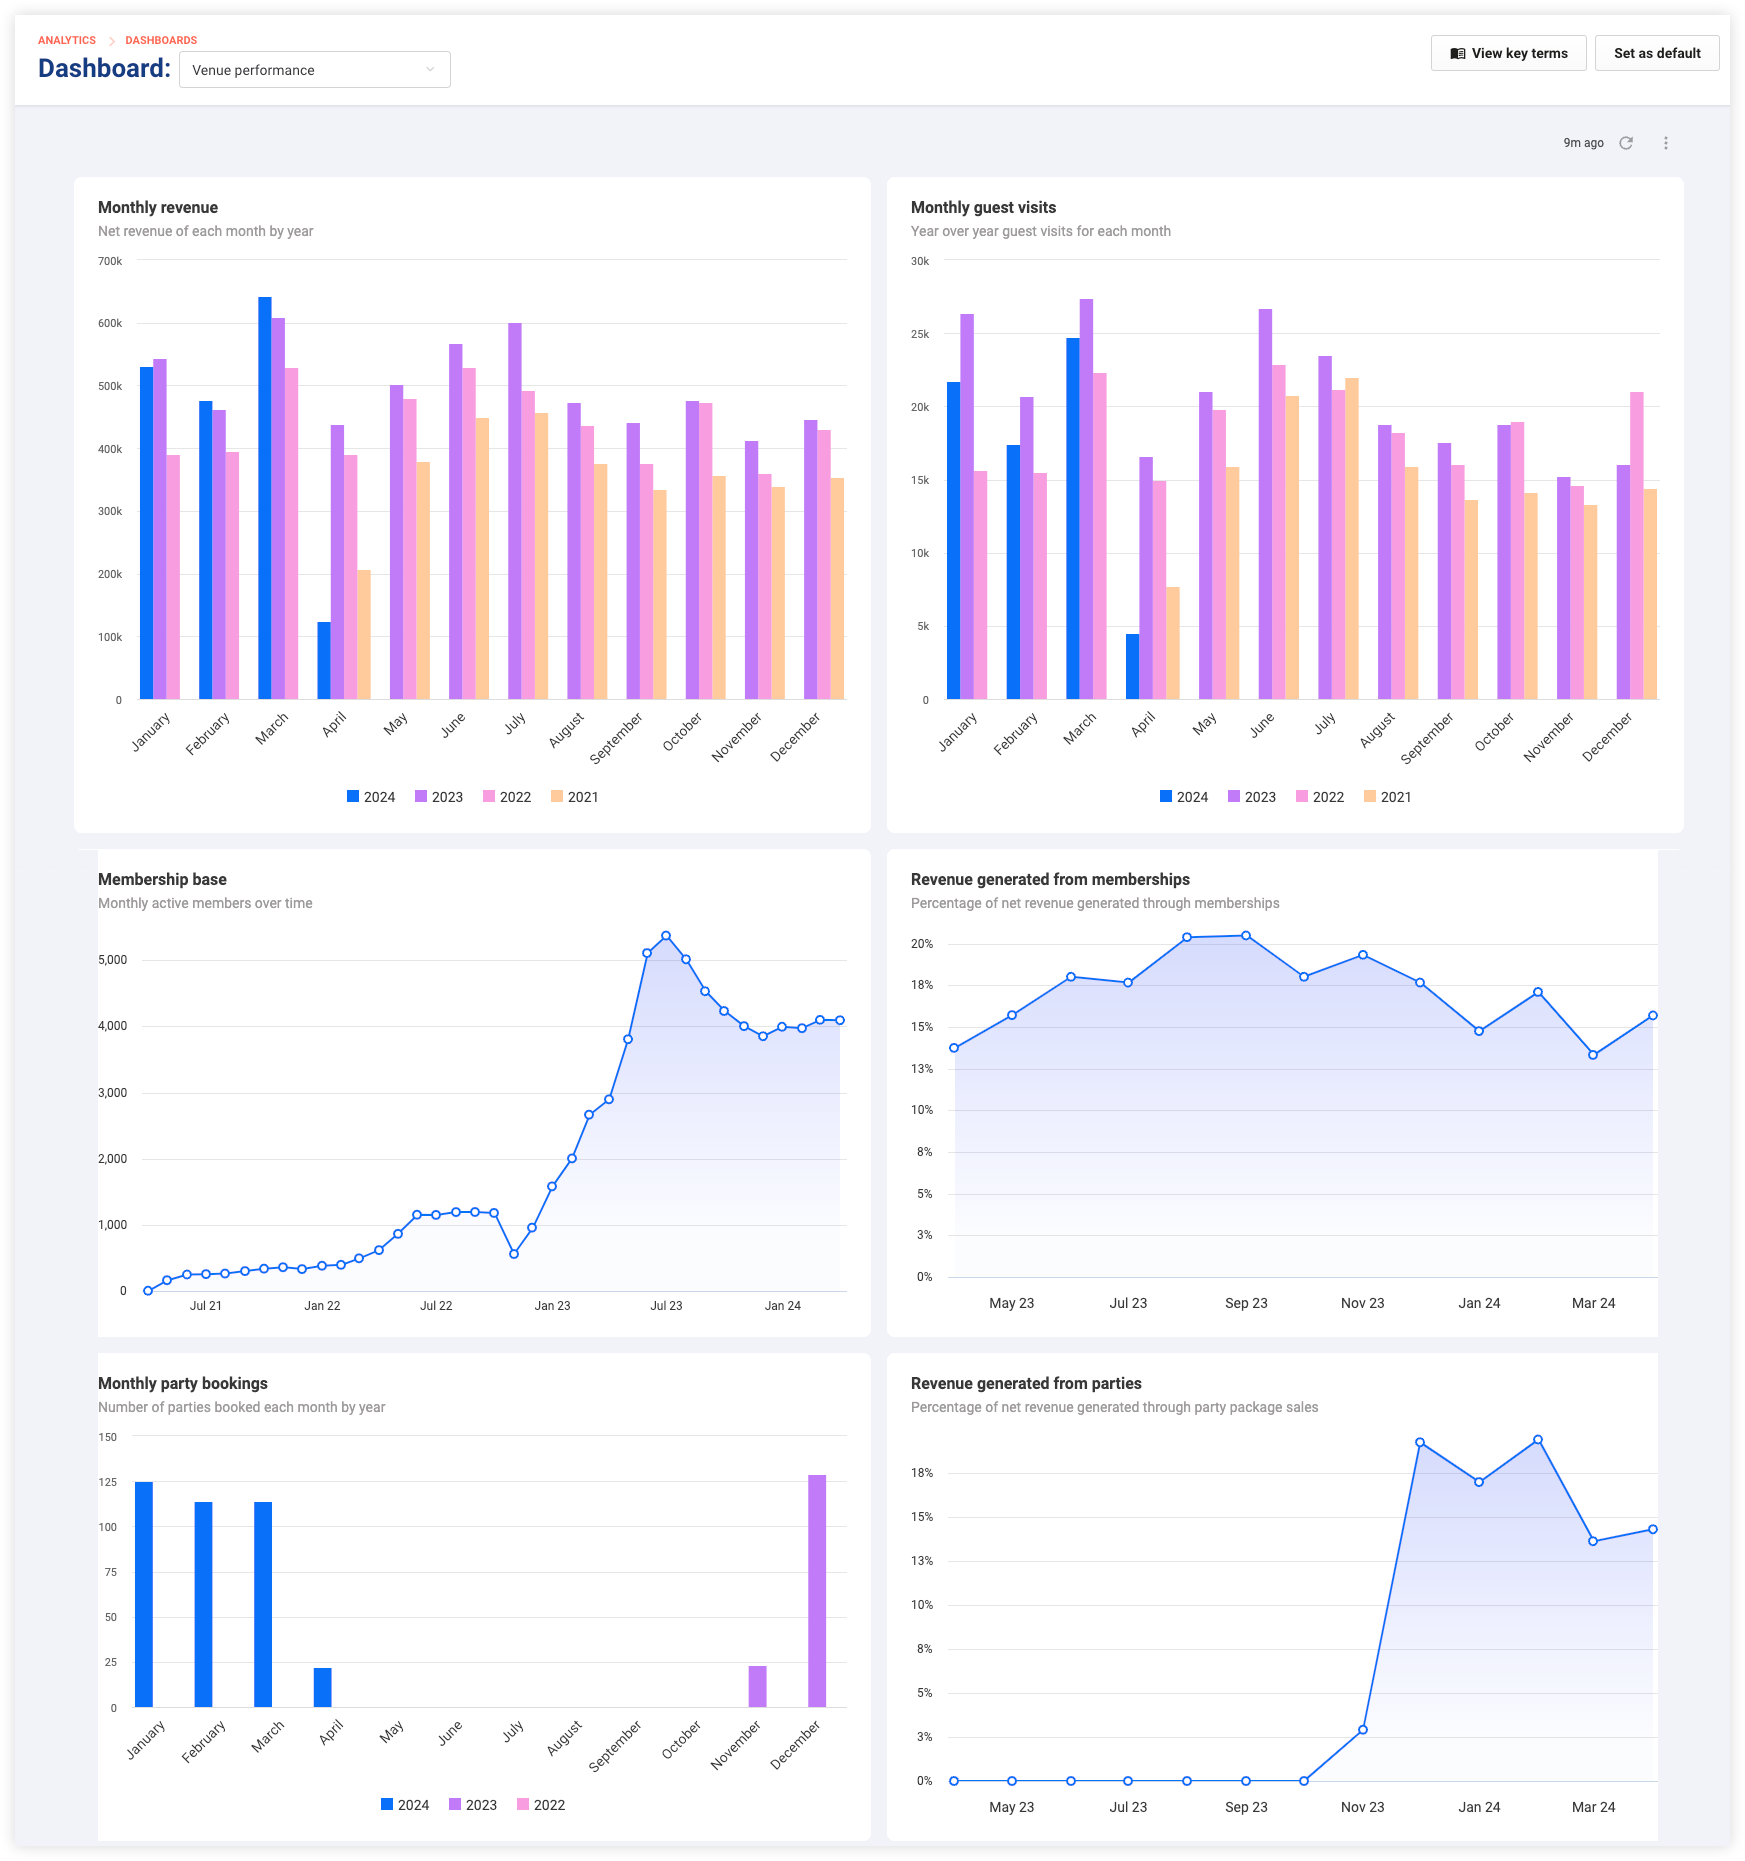
Review the metrics displayed in the visualizations, then refer to the table below to see how they are defined and calculated.
Metric | Definition / calculation |
|---|---|
Monthly revenue year over year |
|
Monthly guest visits year over year |
|
Membership base |
|
Revenue generated from memberships | Line chart showing the proportion of total net revenue derived from membership sales and renewals. |
Monthly party bookings | Bar chart displaying the number of redeemed party package bookings each month, compared with the same month in the past two years. A party booking includes any booking made for a party package. |
Revenue generated from parties | Line graph detailing the monthly percentage of net revenue generated by party package products over the last year. |
Learn how you can interact with and download the data from a dashboard.
FAQ
Can I compare different years' performance?
Yes, charts shows comparisons between the current year and previous years for monthly net revenue, monthly guest visits and monthly party bookings.
Can I track the impact of specific party packages, events or promotions on performance?
The dashboard gives an overall view, but you can monitor the revenue impact of any changes you've made, such as new product launches, events or promotions.
Why does it show as no results in some of the dashboard titles?
The second row of tiles shows membership program data and the third row shows party package data. If you are not selling memberships or party packages, no results will show up here.