See how every venue in your group is performing — without logging in to each one separately. HQ analytics brings together revenue, guest activity, memberships and product sales from all your managed venues into a single view, so you have everything you need to make better decisions, all in one place.
HQ subscription
Available for all HQ venues. To learn more, contact your customer success manager or the support team.
Access a multi-venue dashboard or report
You need the Can access Analytics permission to view dashboards and reports. The administrator and manager roles have this by default, as do any custom roles based on them.
From your HQ venue:
Go to Analytics. The HQ performance summary dashboard loads by default.
Select at least one country in the country filter, then select the refresh icon to update the dashboard. No data loads until you select a country.
Apply additional filters such as date range or venue to narrow the view. For accurate comparisons, choose venues that share the same currency — all amounts display in dollars.
Go to Dashboards to select a different dashboard from the list.
Select Reports to select a report from the list.
Dashboards
Dashboards give you a visual overview of key metrics across all your venues in one place.
HQ performance summary
Your starting point for any group performance conversation. Revenue, visits, memberships and party bookings — all in one view.
HQ performance trends
See whether performance is improving, flattening or dipping over time. Tracks revenue, visits, memberships and party bookings across the group.
Venue performance comparison
Compare venues side by side to see which locations are driving revenue, what's selling, and how guests are booking and redeeming.
Online checkout revenue
Online revenue, order sizes and your most popular products across the group.
Staff sales insights
Individual staff member sales and overall sales distribution from POS and Venue Manager.
Guest analytics
Guest preferences, demographics and spending habits to inform marketing and experience decisions.
Recurring membership overview
Membership acquisition and retention metrics across the group.
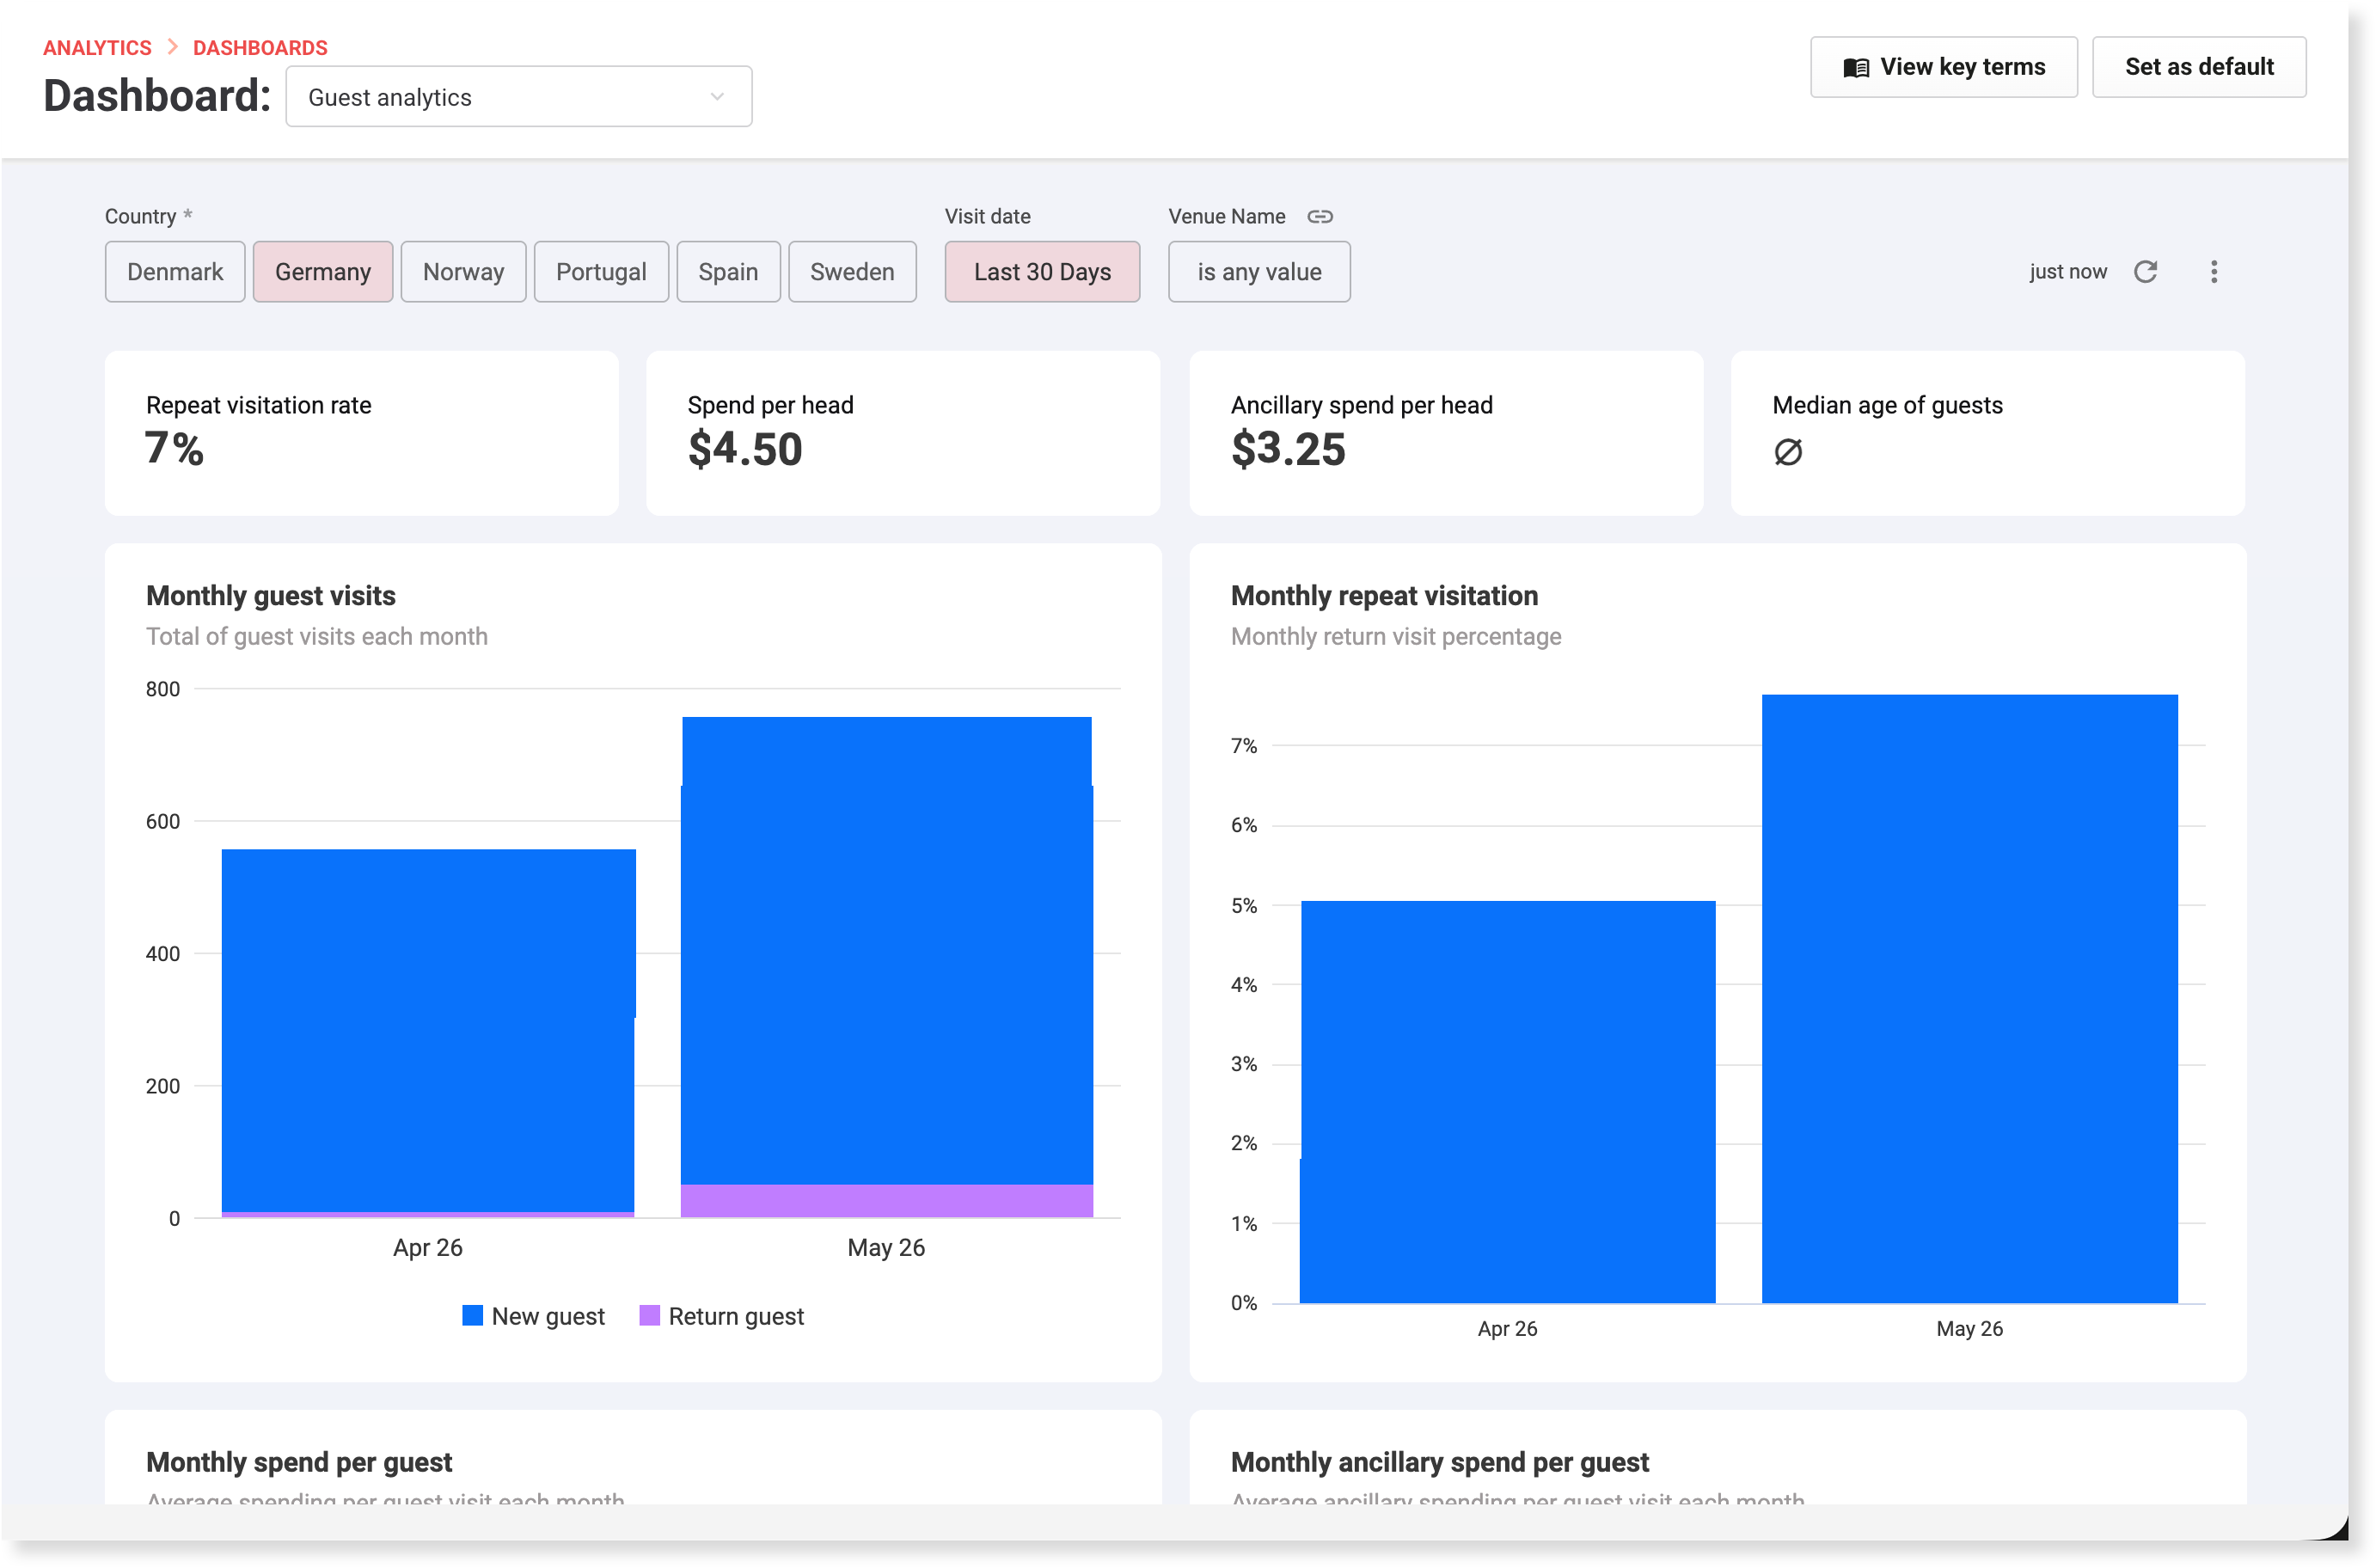
Dashboard filter by country
Use the country filter at the top of any HQ analytics dashboard to choose which venues to include.
Select venues that share the same currency when comparing across countries. All amounts display in dollars.
Reports
Reports give you a single, detailed view with more filters and data — useful when you need to investigate a specific metric or venue.
Net revenue & sales by product
Net revenue and sales broken down by product across the group.
Venue product sales & revenue
Product sales and revenue broken down by venue.
Revenue by reporting category
Net revenue and sales broken down by reporting category.
Cross-venue gift card activity
Gift card payable and receivable balances between venues for a selected date range. Available to HQ venues using multi-venue gift cards.
FAQs
What's the difference between HQ analytics and venue-level analytics?
Venue-level analytics in Venue Manager shows data for a single venue. HQ analytics aggregates data from all your managed venues and adds cross-venue comparison dashboards and reports that aren't available at the individual venue level.
Can I compare venues in different countries?
Yes. Use the country filter to select the countries you want to compare. For accurate comparisons, choose venues that share the same currency — all amounts display in dollars regardless of local currency.
What is the cross-venue gift card activity report?
It shows gift card payable and receivable balances between venues for a selected date range. It's available to HQ venues using multi-venue gift cards.