Find the figures behind your venue's questions (eg which products sold best last weekend), then download them to share or work with in a spreadsheet.
This guide shows you how to filter and customize a report, and how to download it.
The permission required to open a report is the Can access permission for its report type (eg Can access Sales reports). The administrator and manager roles have these permissions enabled by default. Staff with Can view bookings can also open the Bookings report.
Show the data you need
Narrow a report to the dates, filters and columns you care about, so it answers your question without scrolling through every row.
The date selector and filters are at the top of each report, and you choose columns from the report grid.
Choose a date range
Match the report to the period you're checking (eg last weekend, or the month you're closing off). Detailed Product Sales, for example, opens on yesterday.
From Venue Manager, go to Reports > All reports.
Search for and select the report you want.
Select the date selector at the top of the report.
Choose an option:
Today, Tomorrow or Yesterday
On... for one date
Between... for a date range
Within the next... or Within the last... for a number of days, weeks or months
Select Apply filters.
Filter a report
Use filters to focus on one part of your business (eg sales made at POS, or one payment device during a busy period).
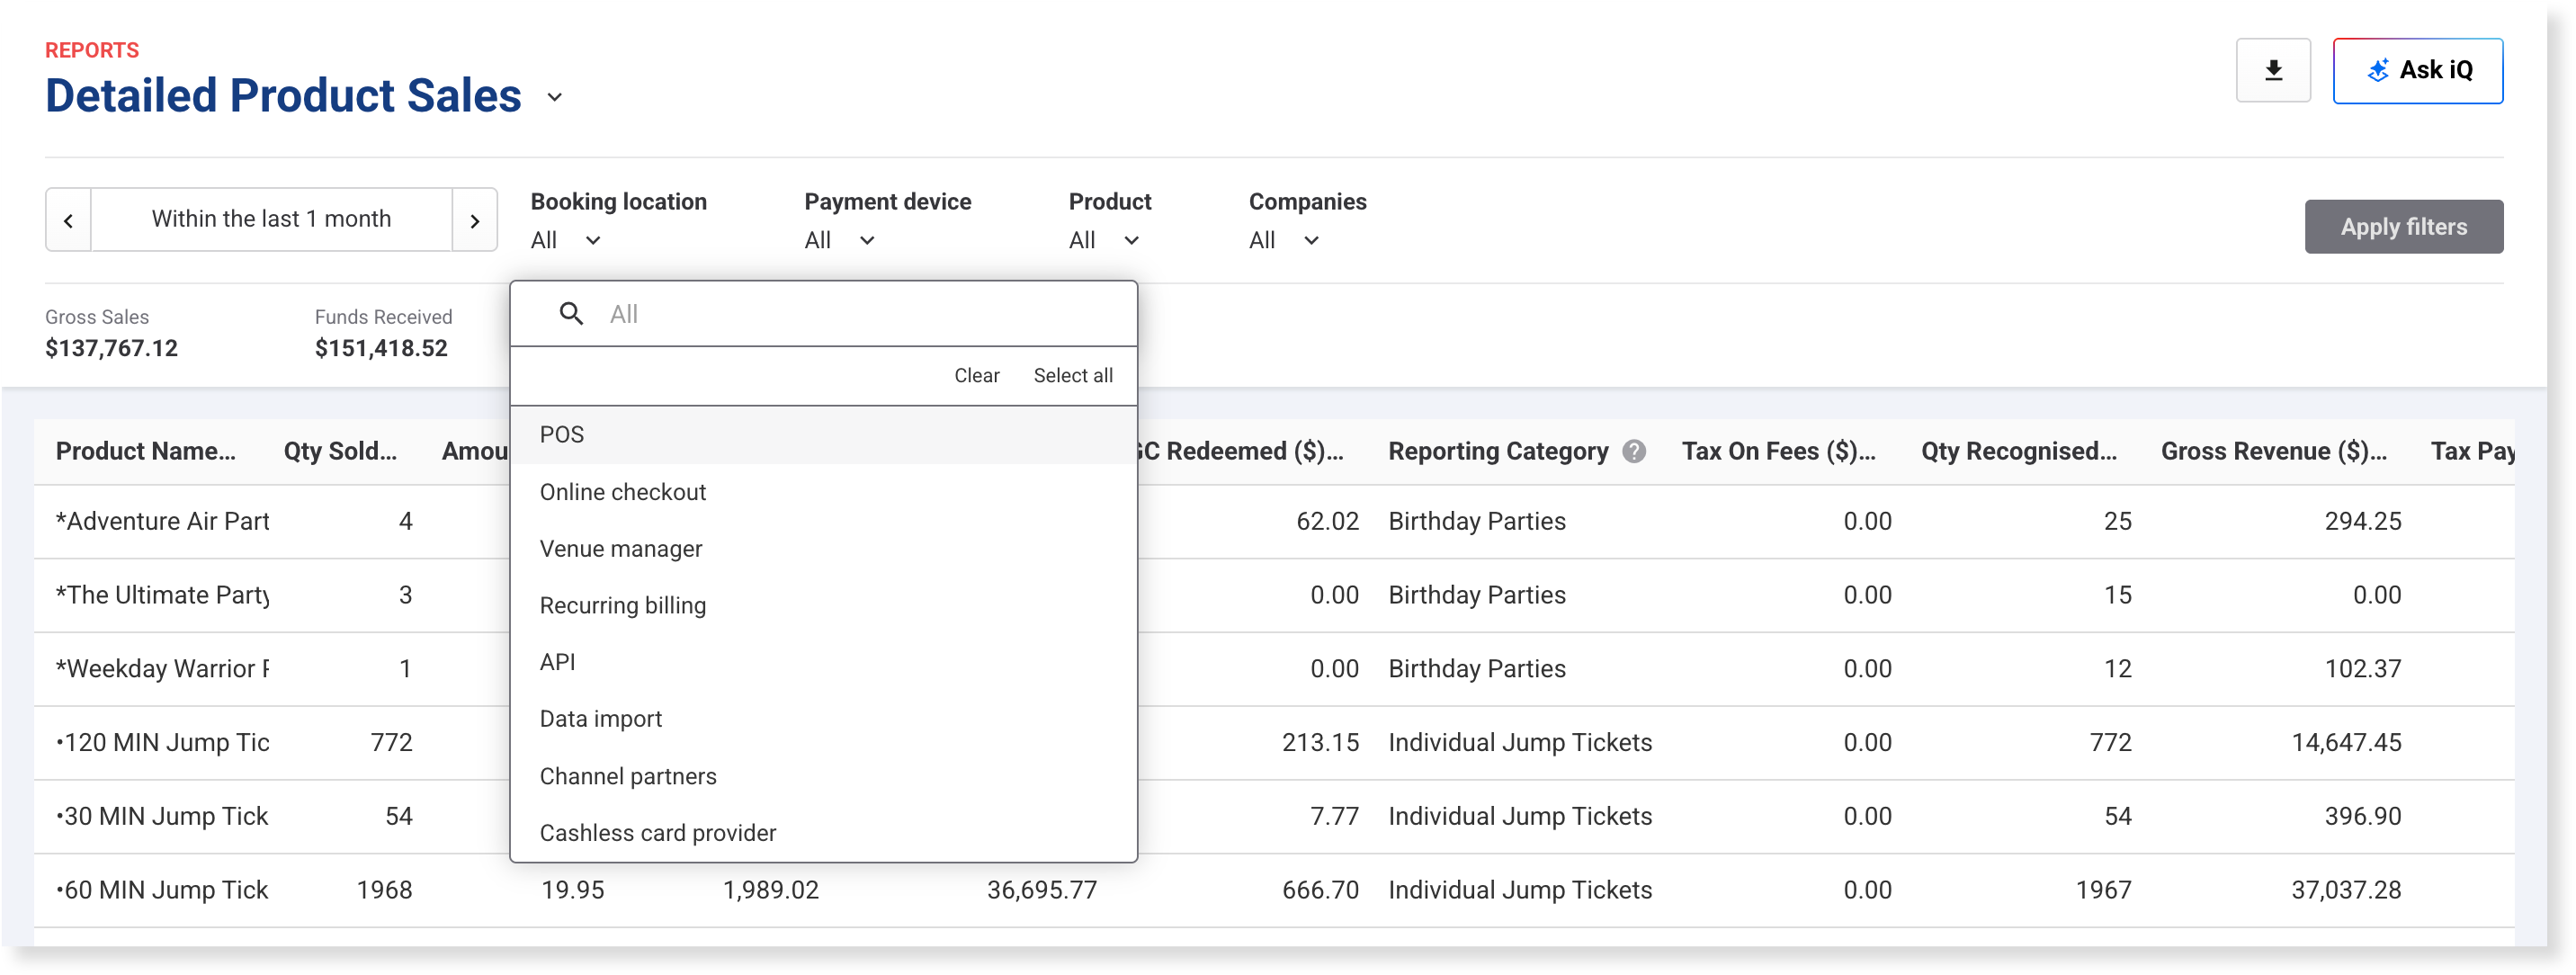
Each report has its own filters, next to the date selector. For example, you can filter Detailed Product Sales by Booking location, Payment device, Product or Companies. After you change a filter, select Apply filters.
Choose and arrange columns
A report with only the columns you need is quicker to read. Sort by a column to see what's on top (eg your best sellers).
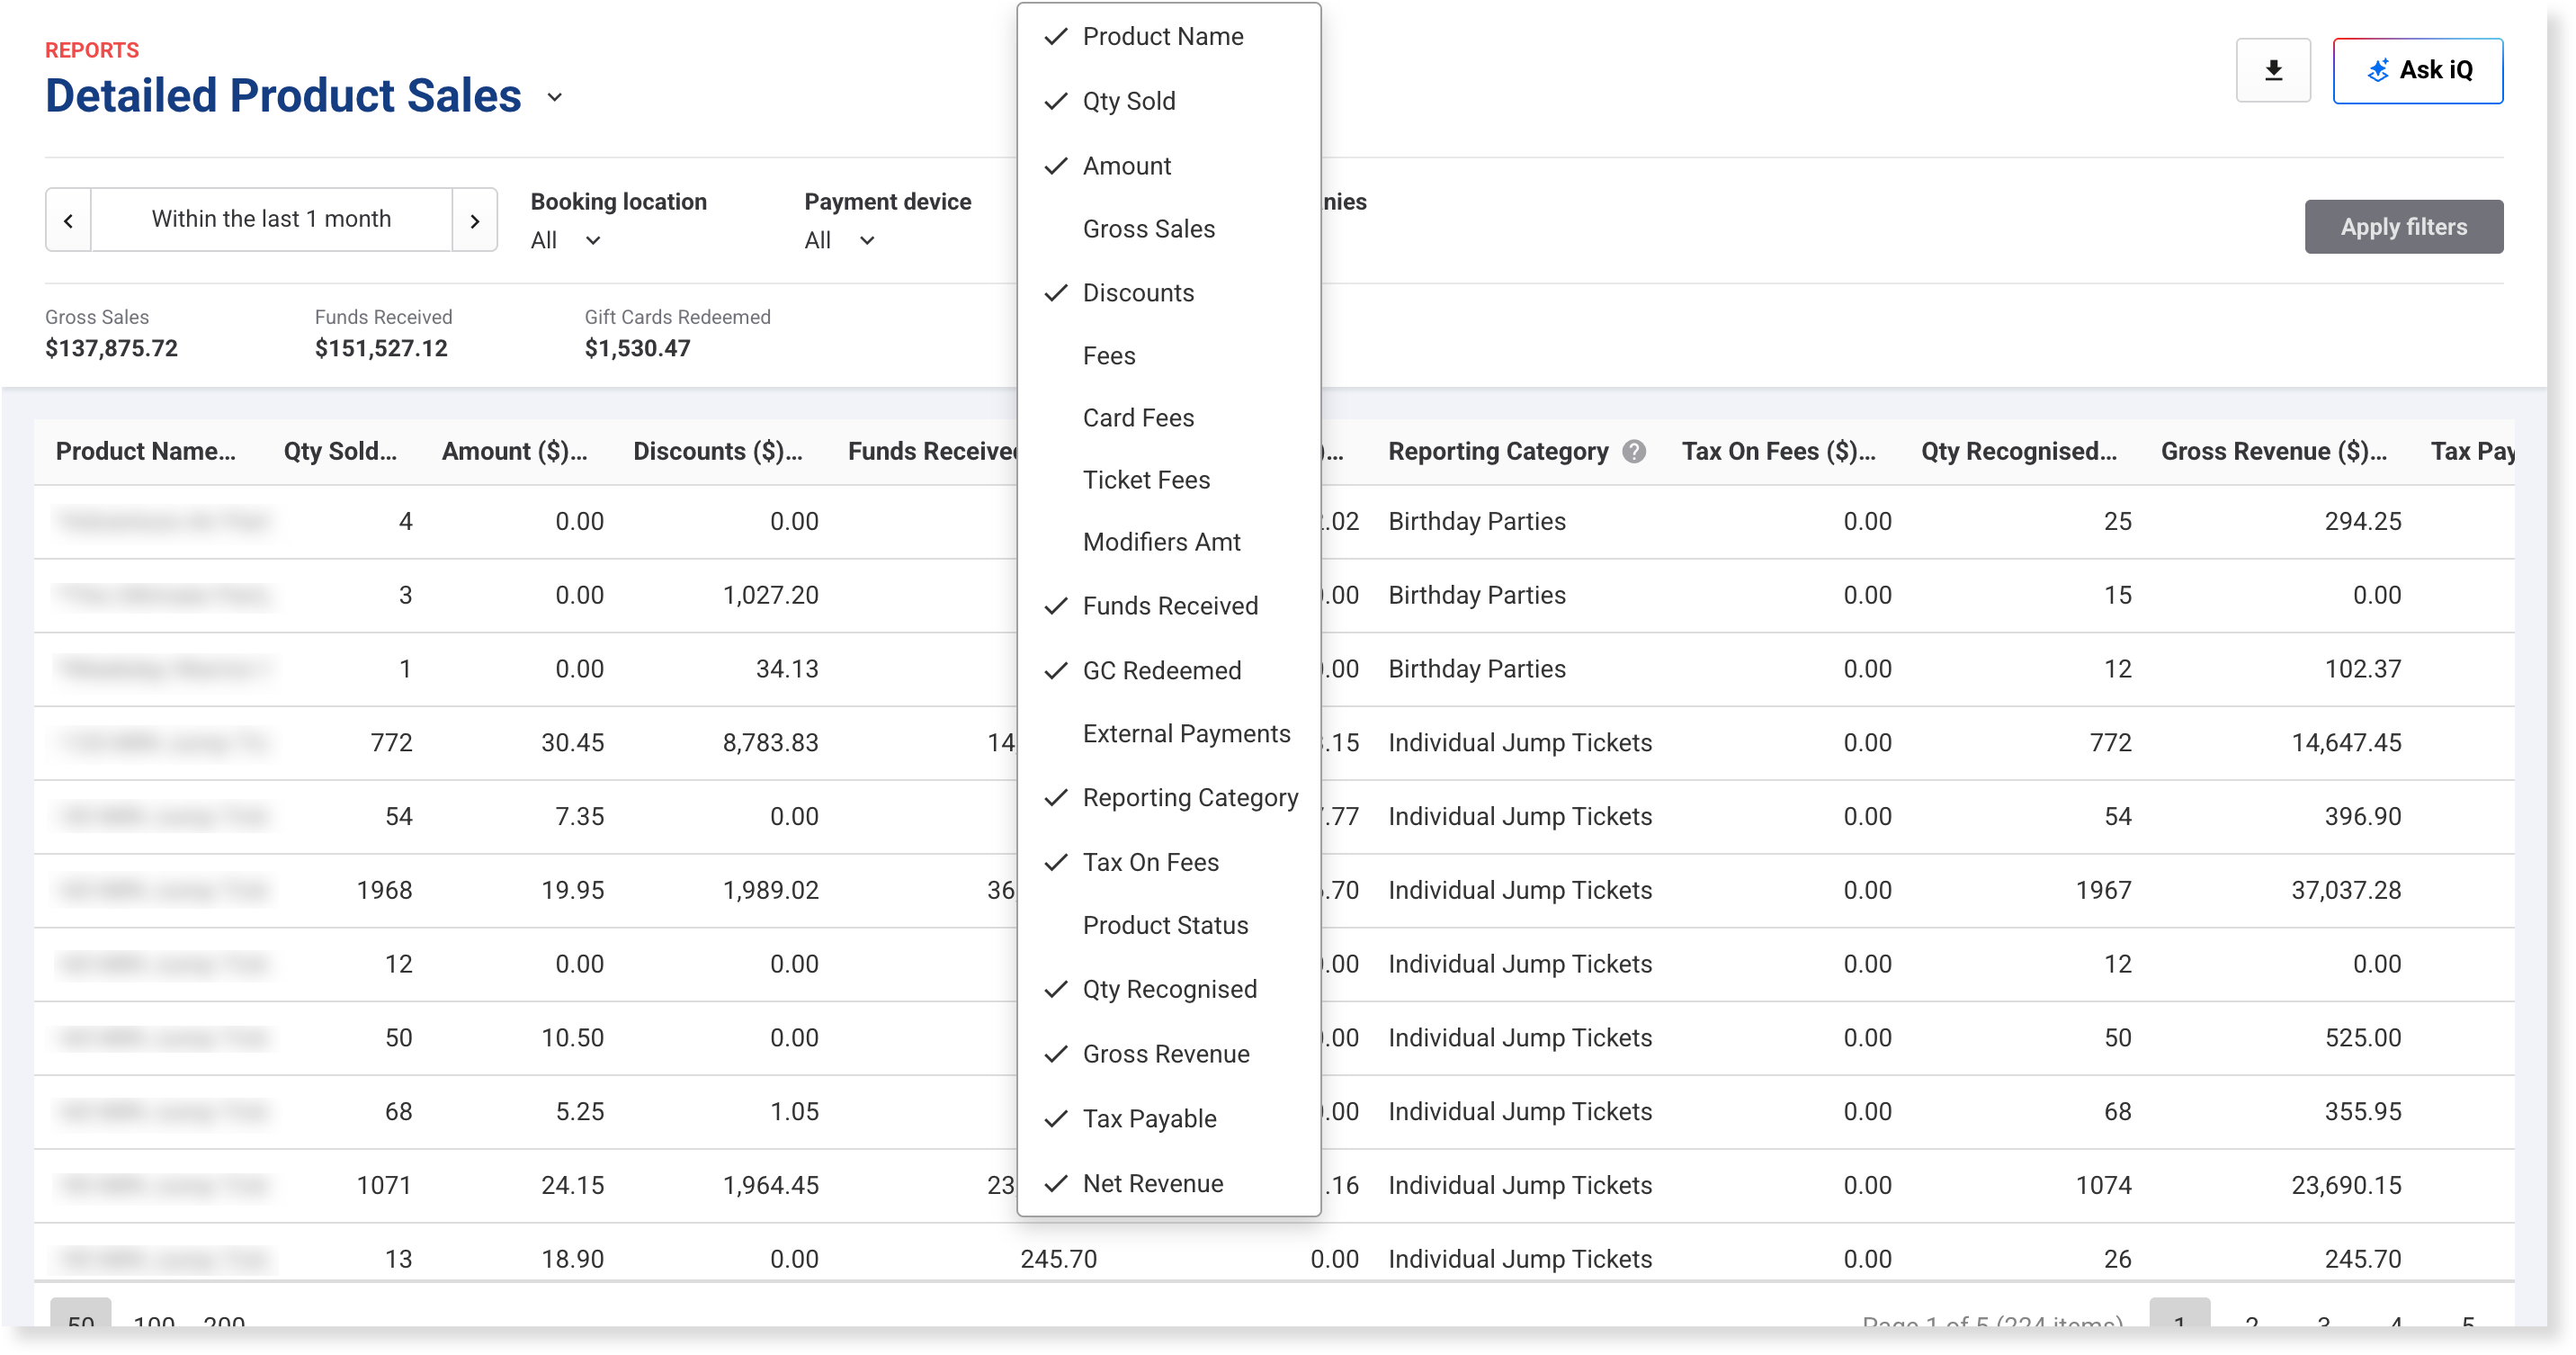
To show or hide columns, right-click the grid and select the columns you want. A tick means the column is shown.
To move a column, drag its header. To resize it, drag the edge of its header.
To sort by a column, select its header.
If a column header has a question mark icon, hover over it to see what the column shows. For definitions of report terms, see the guide Get to know reporting terms in ROLLER.
To keep this layout for next time, save it as a view. To learn how, see the guide Save and reuse customized views.
Group rows by a column
Grouping rows breaks a report down by one column (eg all POS transactions together, separate from recurring billing).
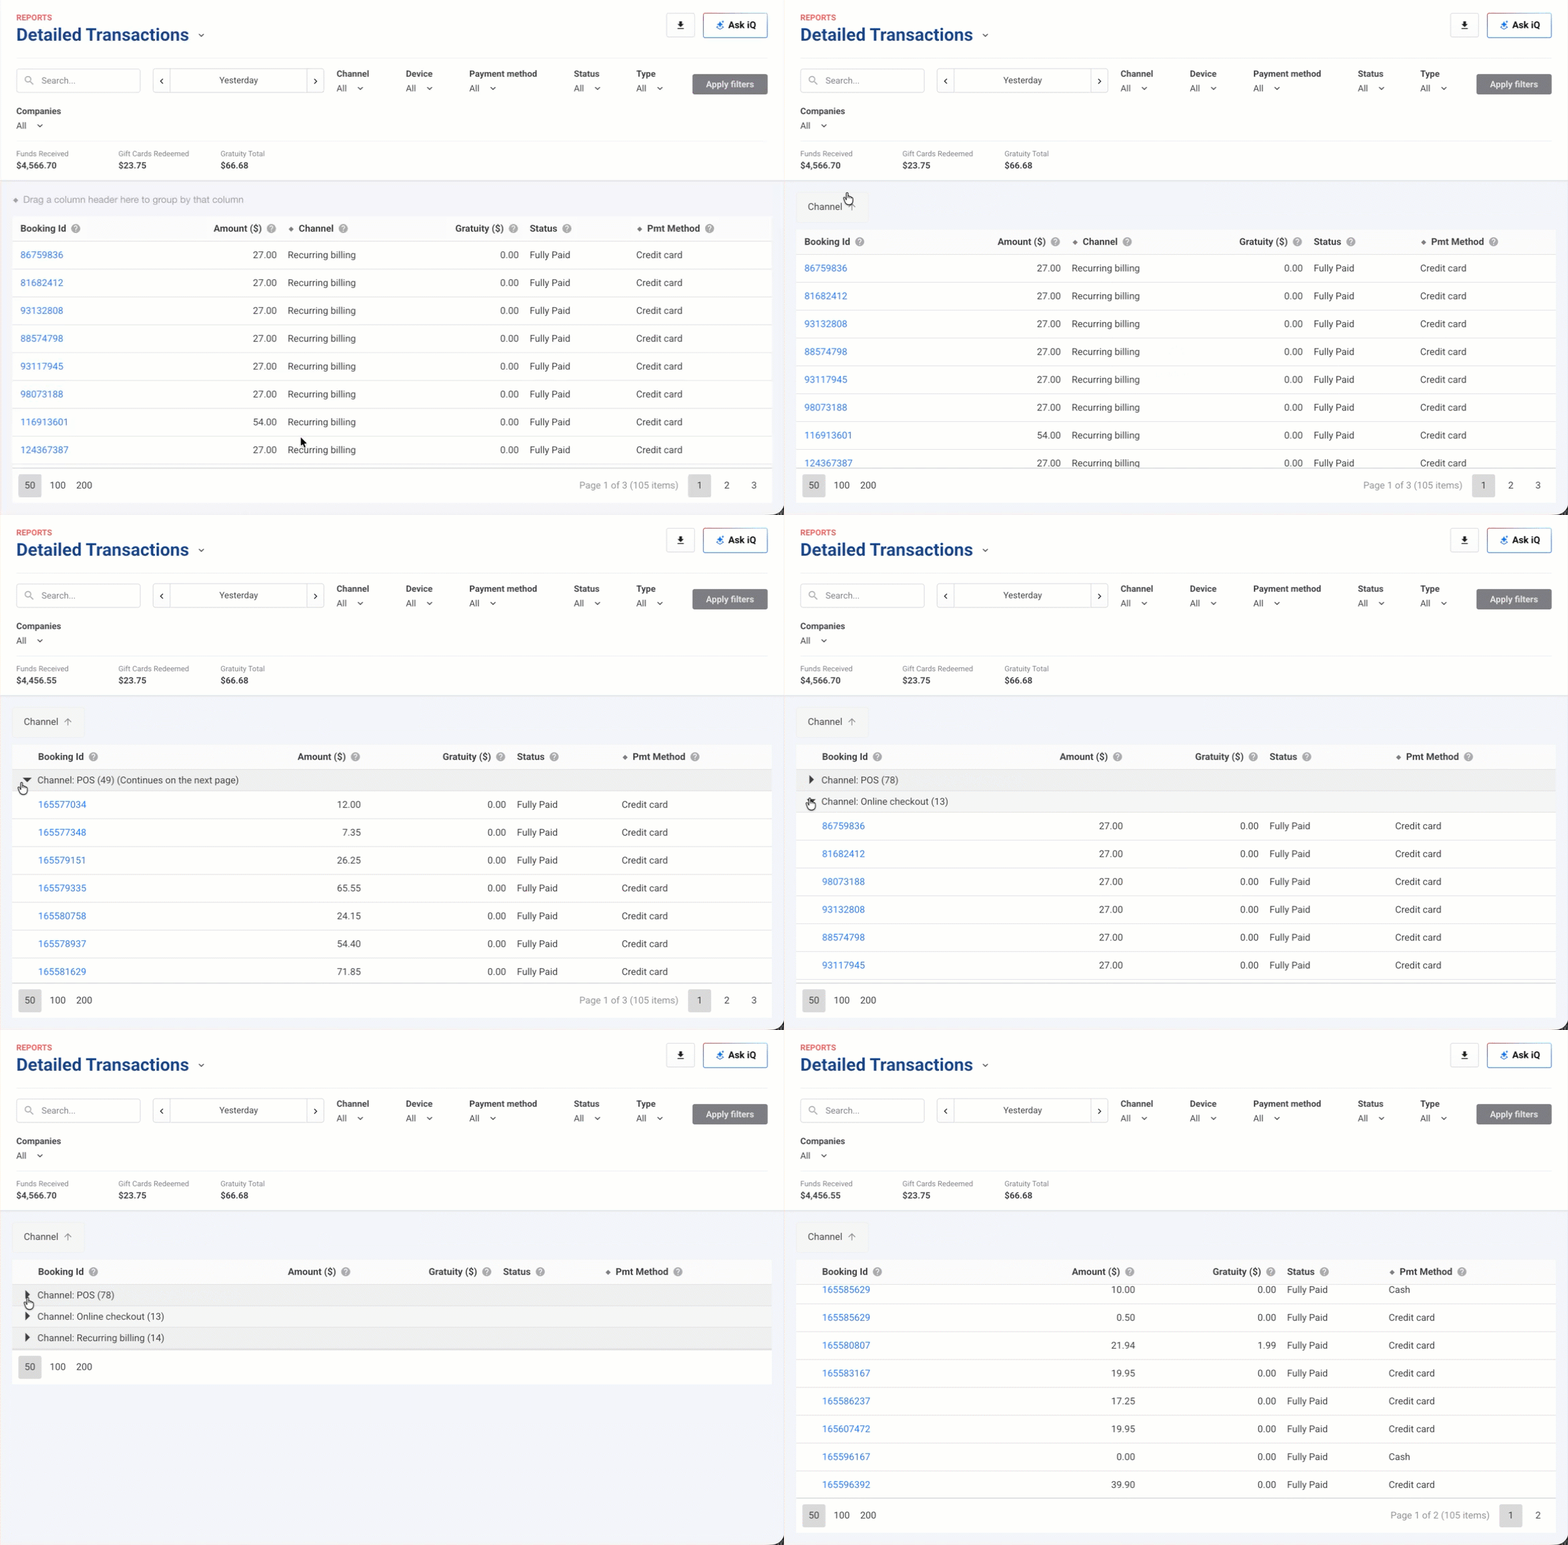
Columns with a diamond icon next to their header can be grouped.
Drag one or more of them to the grouping area at the top of the grid.
The rows then show in groups you can expand and collapse. To change the order of your groups or remove one, drag it within or out of the grouping area.
To keep your groups in a download, download the report as Excel.
Open a booking from a report
When a booking in a report needs a closer look (eg one with a balance still owing), open it without leaving the report.
Select a booking ID to see the booking's details in a side panel (eg status, balance, booking holder and items).
To open the full booking, select Go to booking. This works in reports that include a booking ID.
Get the data out of ROLLER
Download a report to share figures with people who don't use Venue Manager (eg your bookkeeper), or to work with them in a spreadsheet.
Download a report
From Venue Manager, go to Reports > All reports.
Search for and select the report you want.
Set the dates and filters (see Choose a date range and Filter a report earlier in this guide).
Select the download button at the top right of the report.
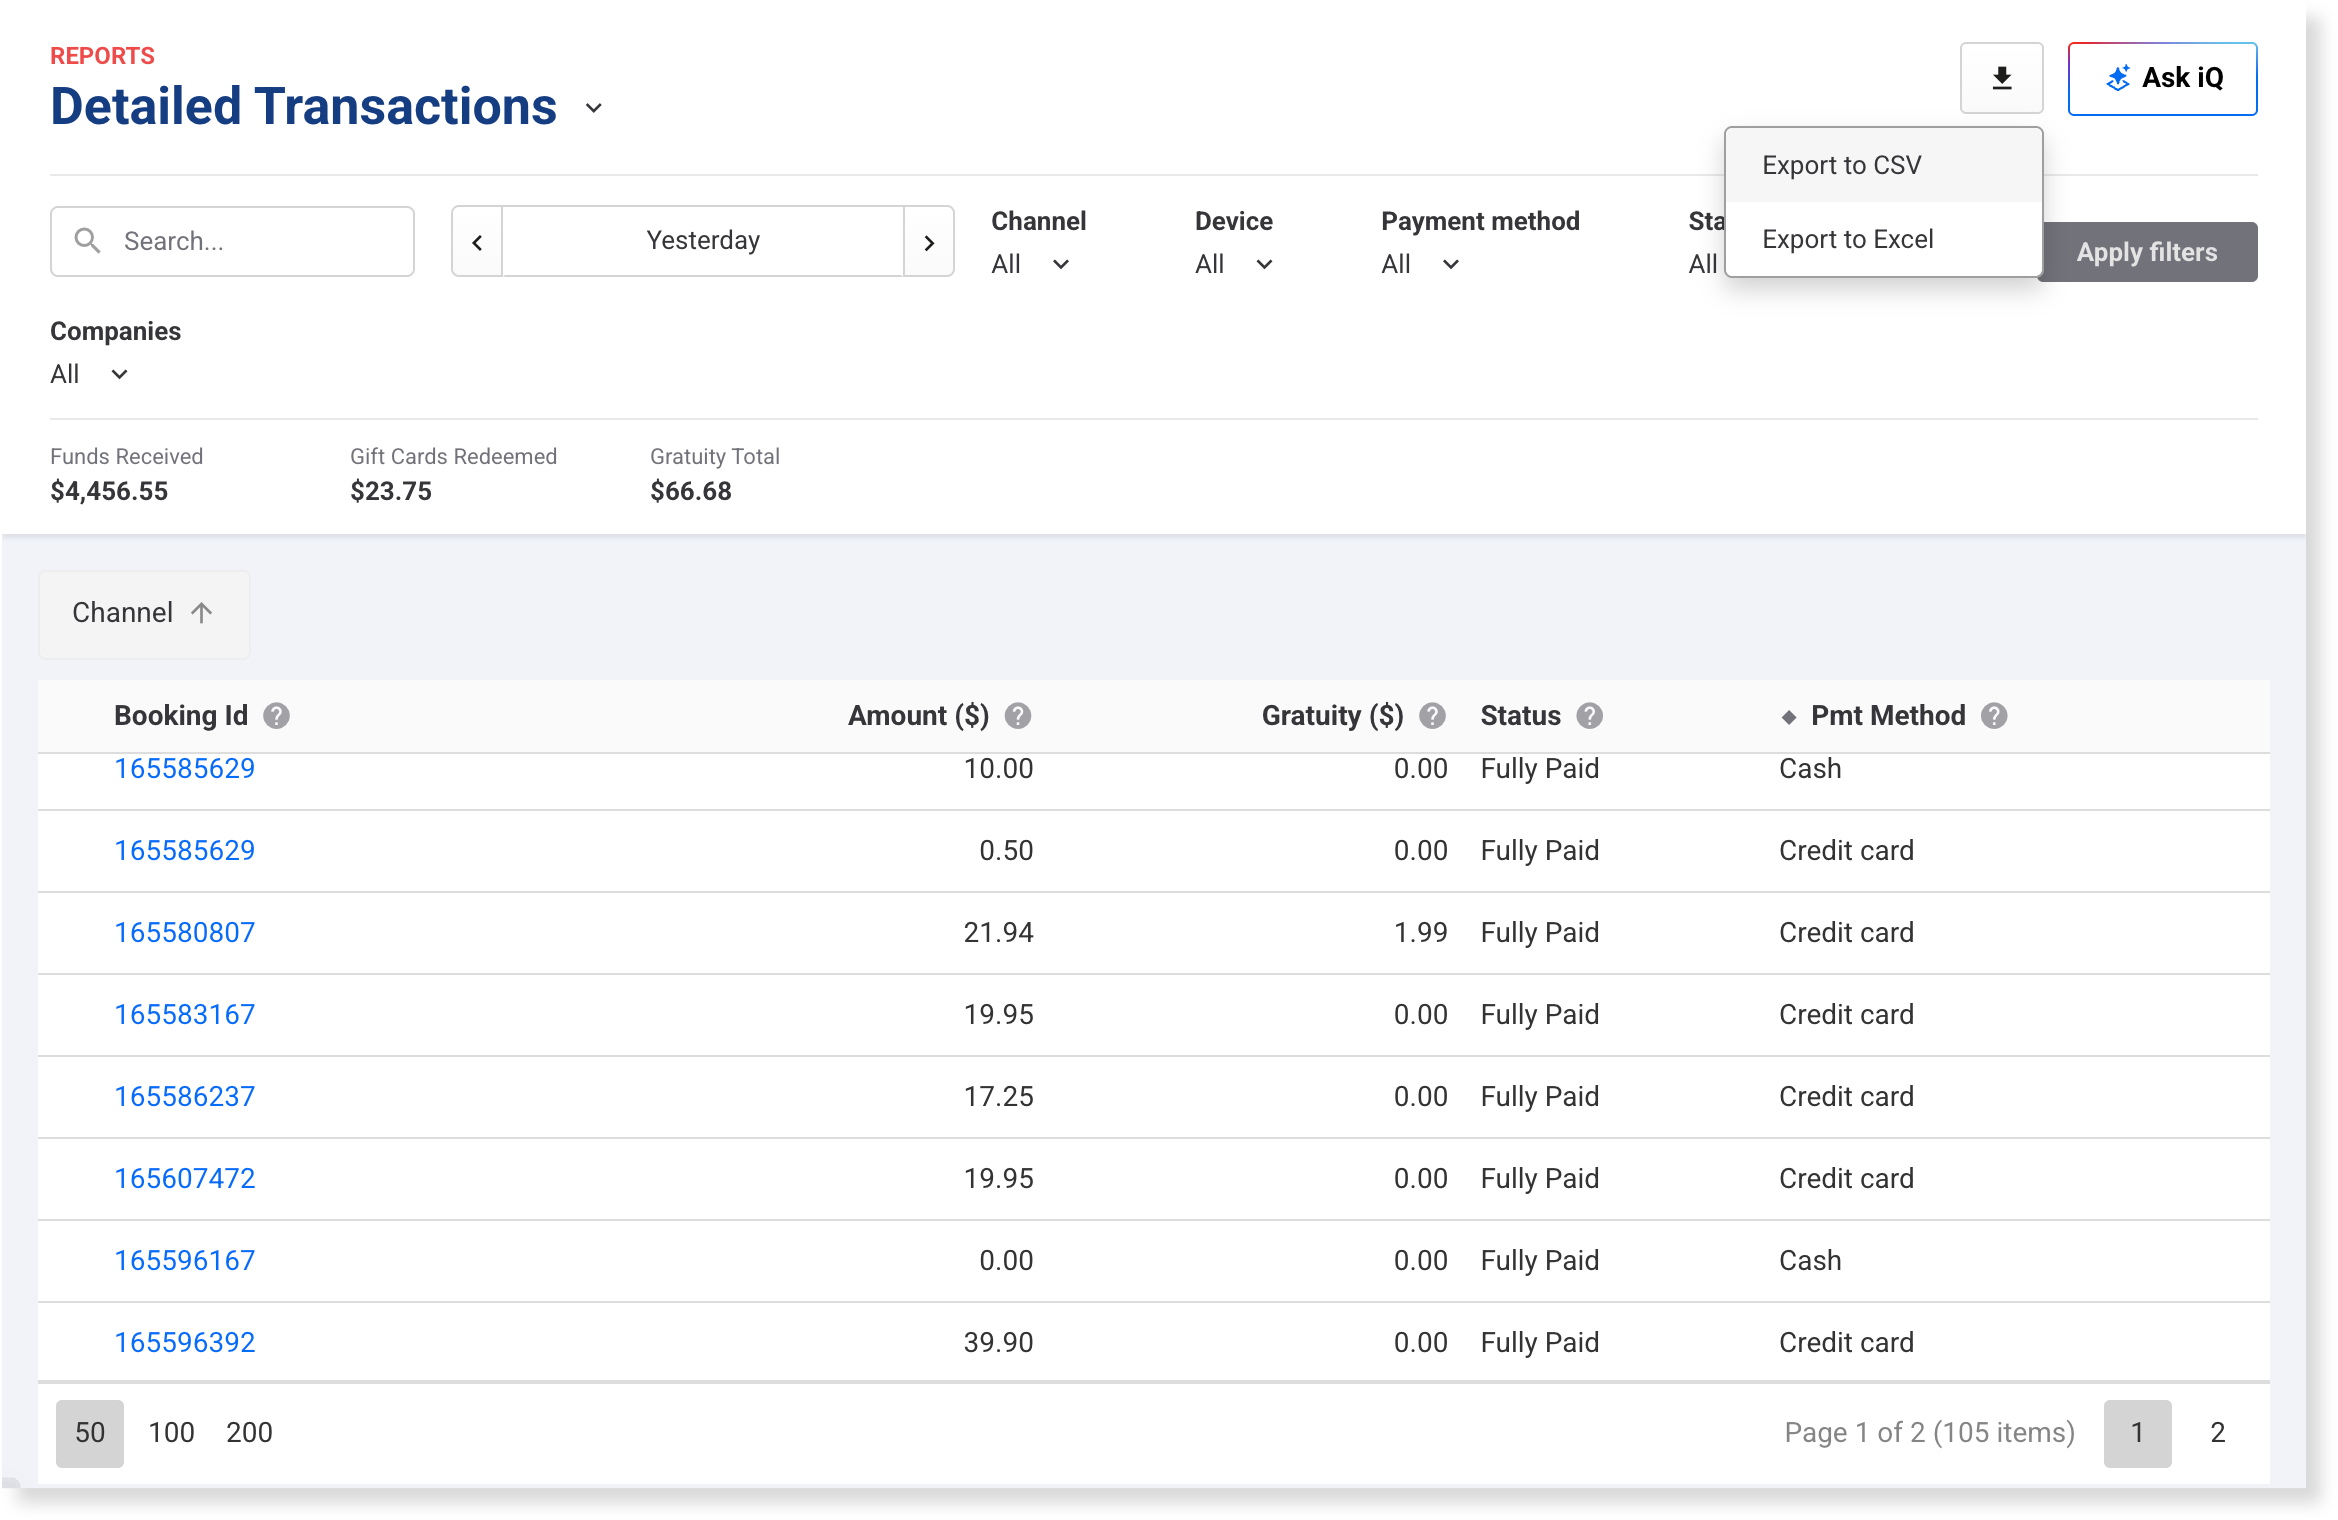
Select Export to CSV or Export to Excel.
Select Alert me when complete.
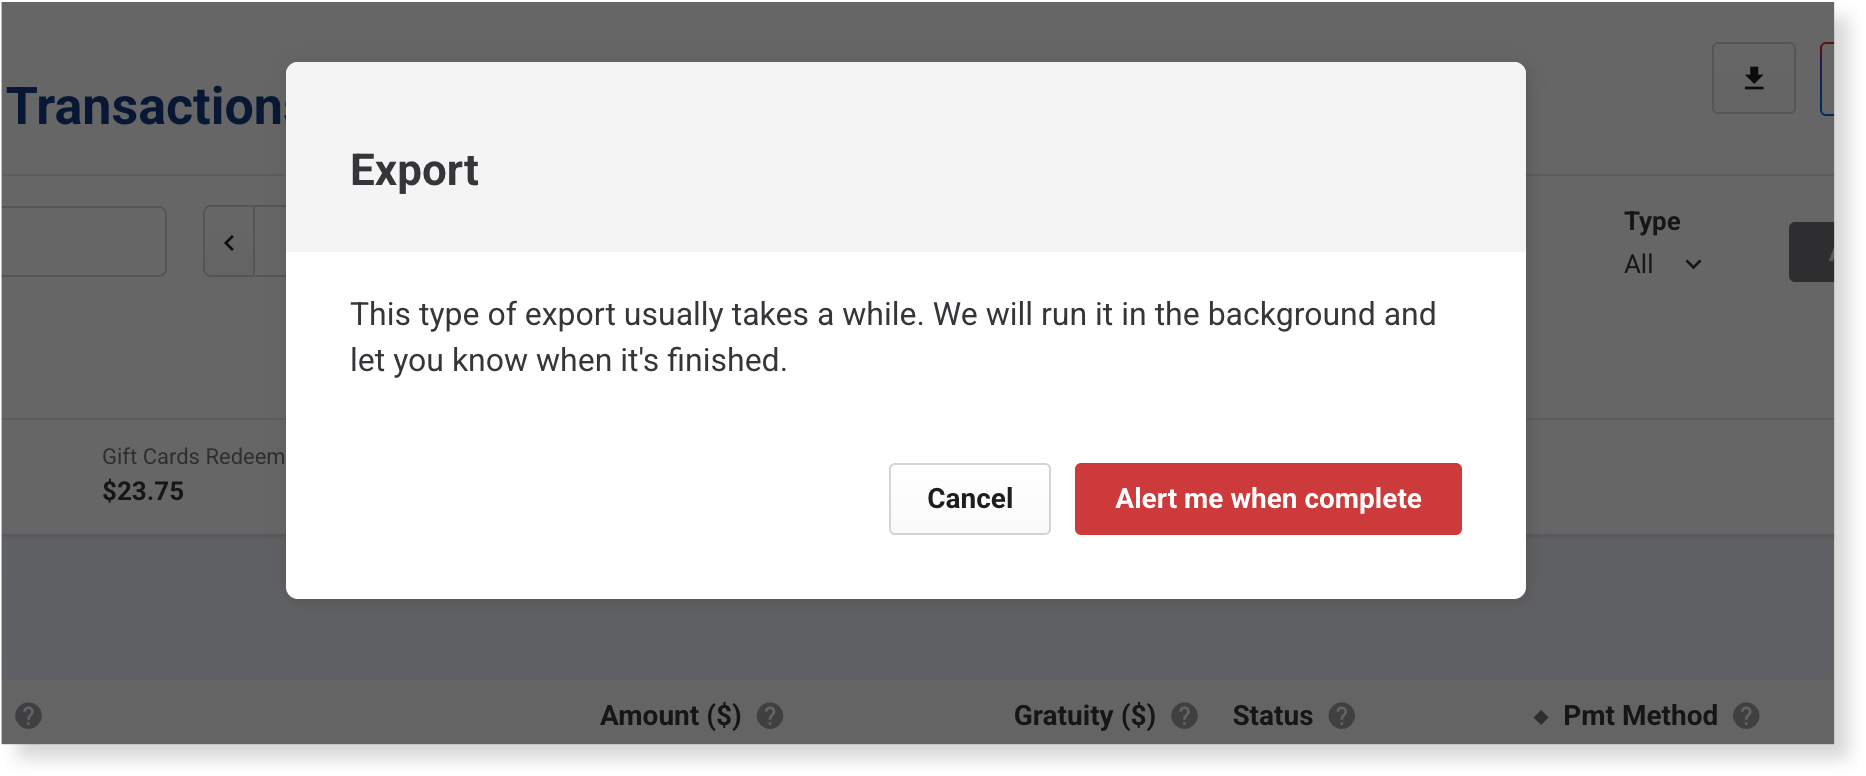
ROLLER prepares the file in the background, so you can keep working.
When it's ready, a red dot appears on the notifications icon (bell) at the bottom of the left menu. Select the bell, then select the download icon next to your report.
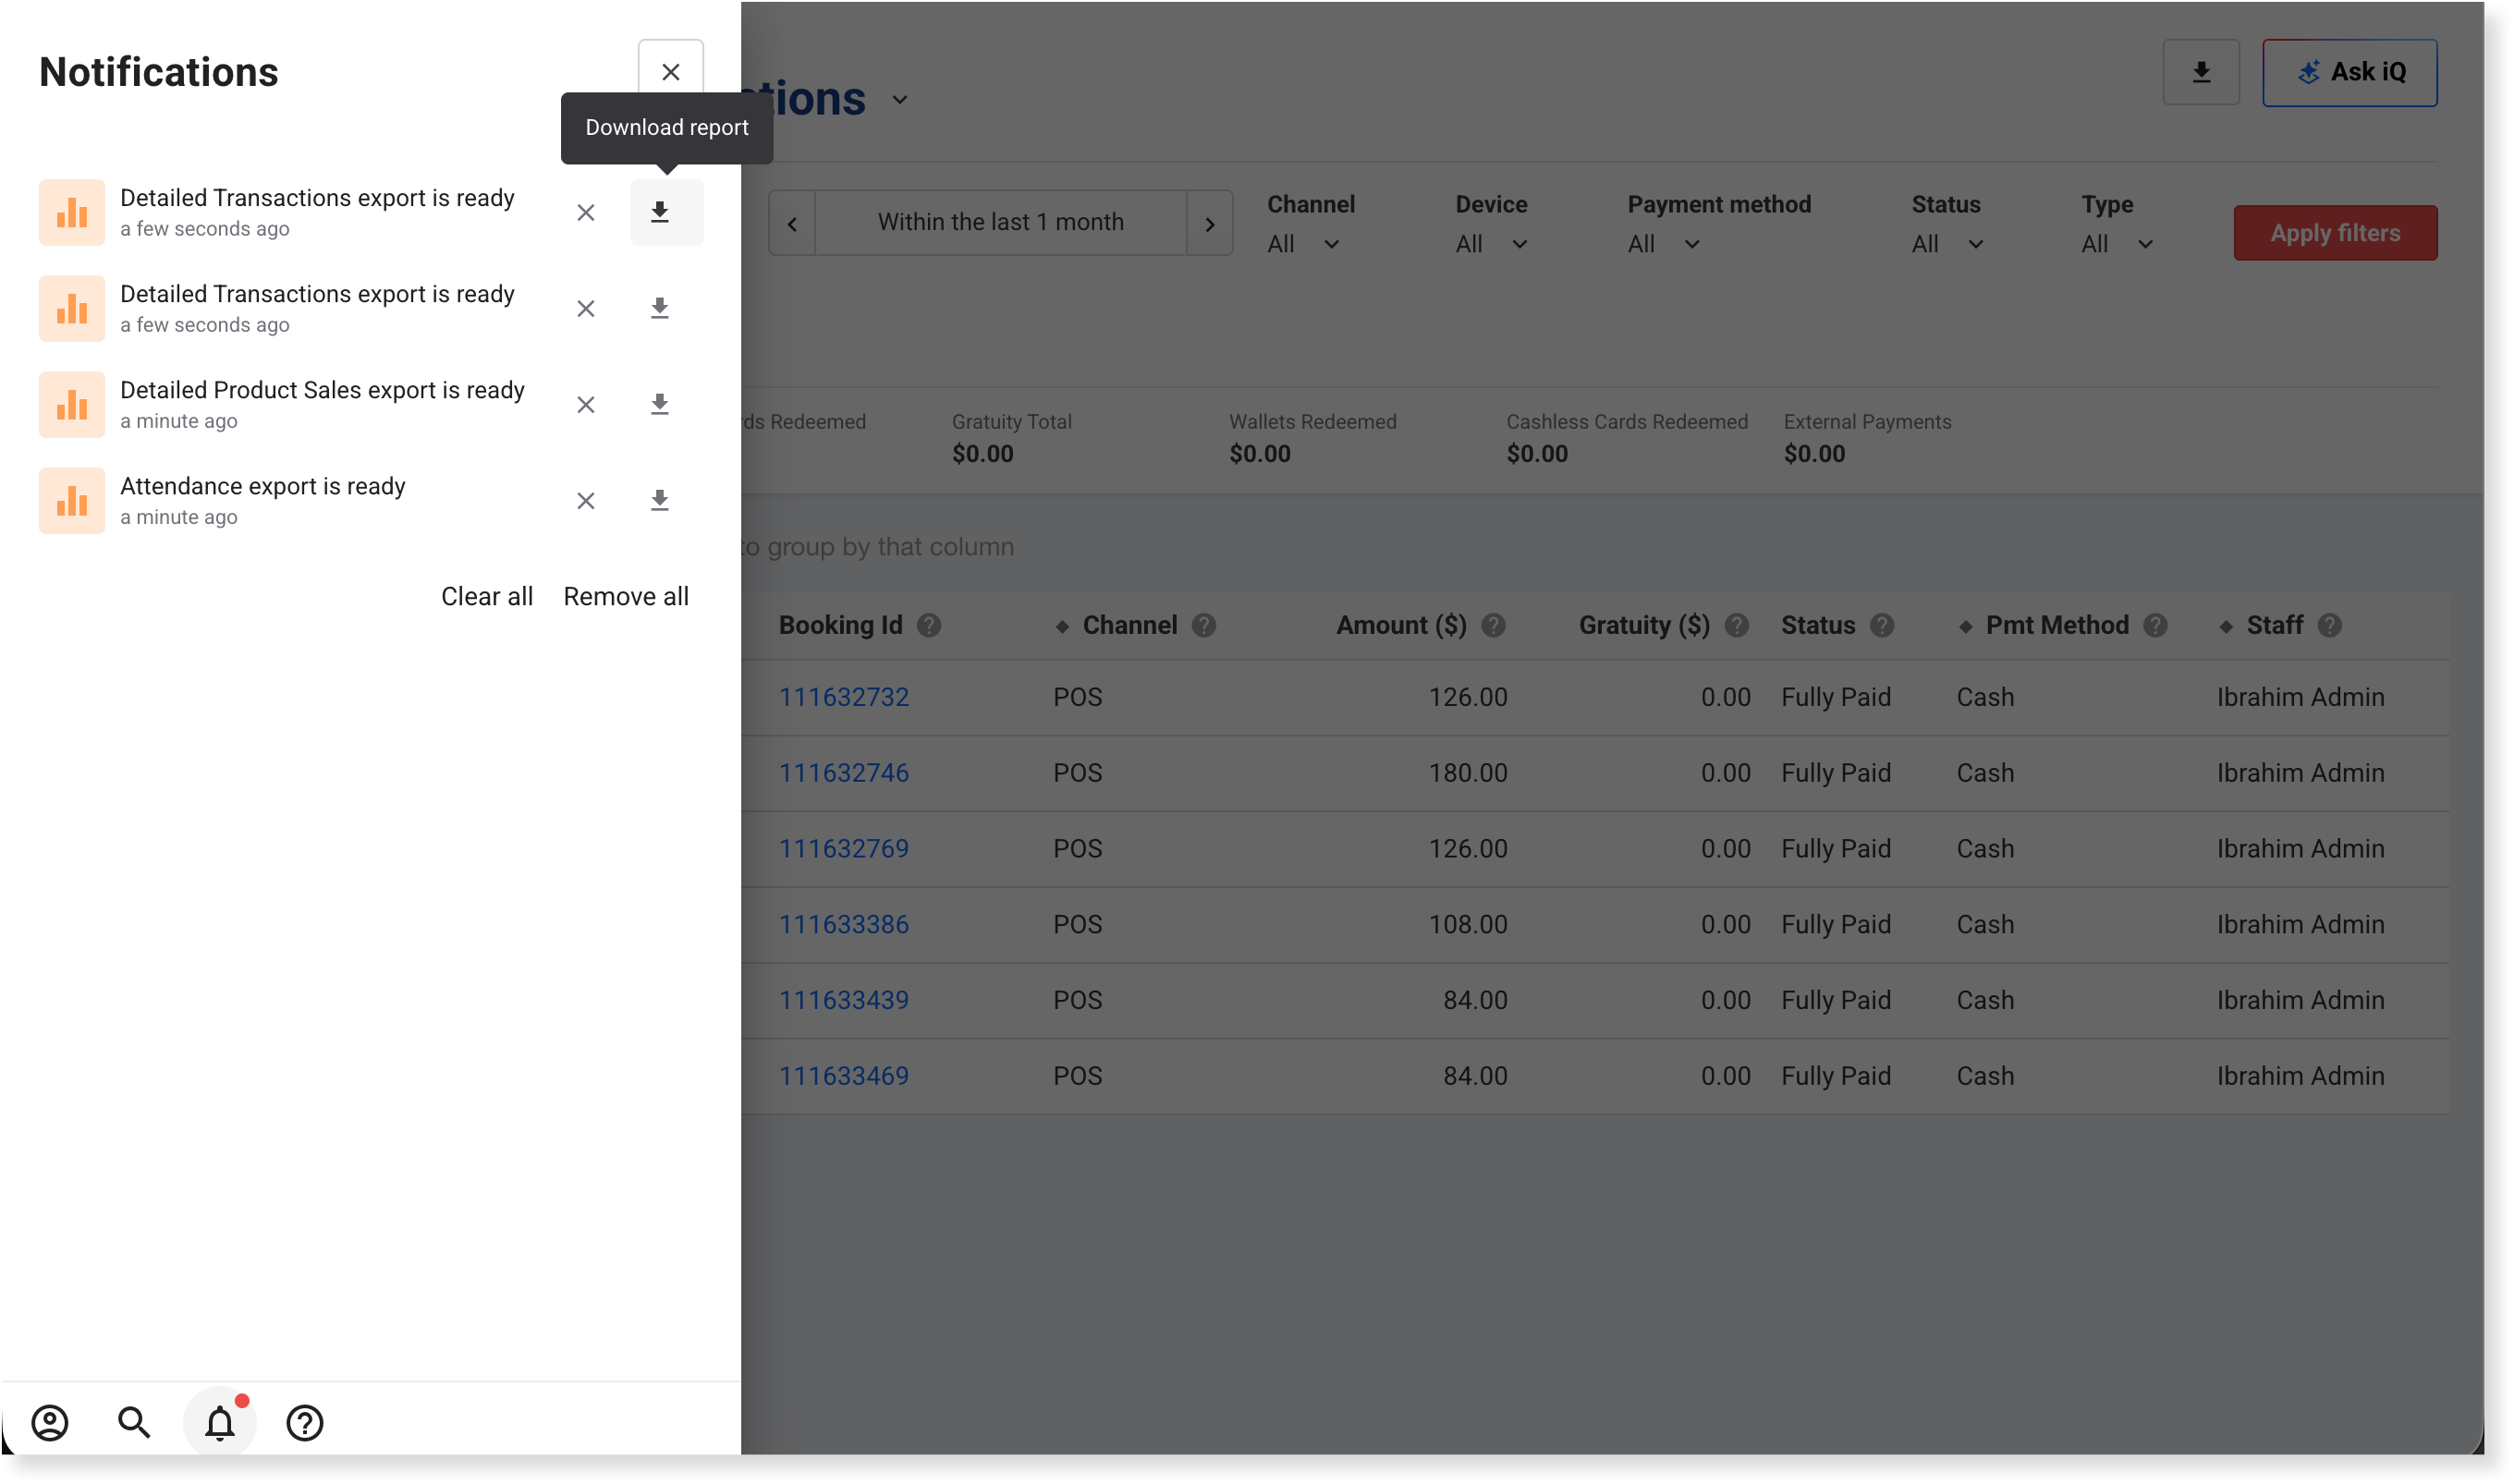
To remove a notification, select the X next to it. To remove all of them, select Remove all.
Clear all marks every notification as read and keeps them in the panel. The notifications panel also holds other exports that run in the background (eg run sheet PDFs).
To email a report on a schedule, see the guide Email reports on a schedule.
FAQs
Why does my download include columns I hid?
A download includes all the report's columns, not only the ones on screen. It uses the report's dates, filters and sort order.
Why can't I download a report as Excel?
Each report offers its own formats, and the download menu shows only those (eg Detailed Product Sales offers CSV only). To keep your groups in a download, you need Excel.
What does "export limit reached" mean?
You have exports still being prepared. Wait for them to finish. ROLLER notifies you when each one is done.
What if my report has too many rows to download?
Choose a shorter date range or more filters, then download it again.
Why is the download icon grayed out in the notifications panel?
Once you download a file, its notification is marked as read. You can still select the download icon to download the file again.