Check how your day is going in one place, without opening several reports. The Venue Manager dashboard shows one day’s bookings and check-ins, funds received, guest survey feedback, membership KPIs and product sales.
Use it to see when your busiest hours will be, or to find members whose recurring payment failed so you can follow them up.
Some sections on the dashboard only appear if the features are available in your platform.
Open the dashboard
From Venue Manager, go to Dashboard. From here, you'll see a high-level daily summary of feedback and key metrics for one day's trading. Open the dashboard at the start of each shift to see what the day holds.
Guest surveys
If you're using guest surveys and you've received feedback, you'll see a high-level snapshot of responses, scores and feedback from guest surveys. Recent guest feedback shows next to your daily numbers. Check it for anything your team should know about before the next shift.
Day or date
When you want to look back at a past day (eg last Saturday) or check bookings for a day ahead, change the date.
The default day is today. Use the date selector at the top right of the dashboard to select a different day or date. Note that you can only view data in this report for one day only.
Venue summary
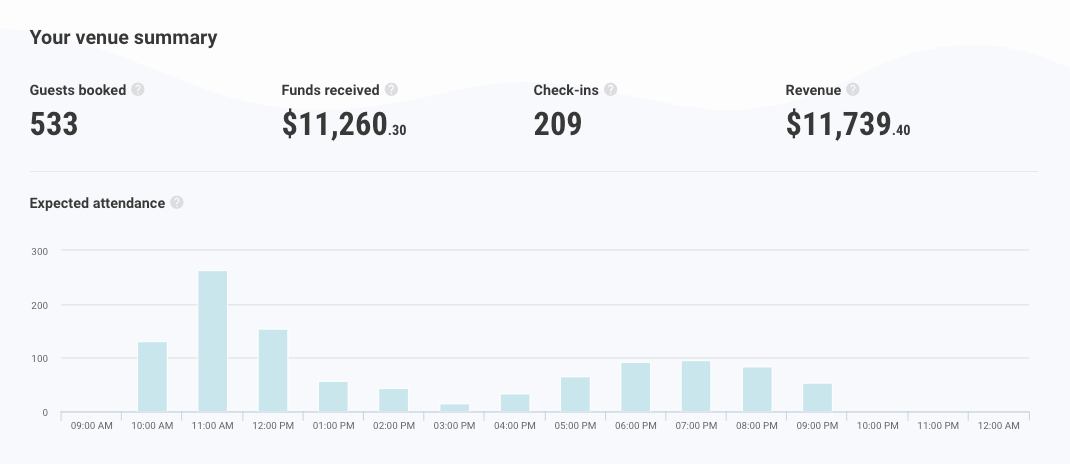
These numbers show how busy the day is and how much money came in.
Guests booked | The number of guest tickets booked for the selected date (not redeemed). Note that this figure does not include stock or add-ons. |
Funds received | The total value of payments processed on the selected date, including deferred revenue such as future bookings and gift card sales. Tips are not included here because tips are recorded at the transaction level, not against individual booking items. |
Check-ins | The number of tickets that have been redeemed (checked-in) for the selected date. |
Revenue | The total recognized revenue (income earned) based on service delivery (ticket redemption at POS or product/ticket expiry) for the selected date. This metric is only included here if your venue has accrual accounting enabled. |
Expected attendance chart | The expected hourly attendance based on commencement time of the booking for the day. Monitor this regularly throughout the day to monitor how busy the venue is. |
For a full breakdown of the day, see the guides Daily Summary report and Attendance report.
Membership KPIs
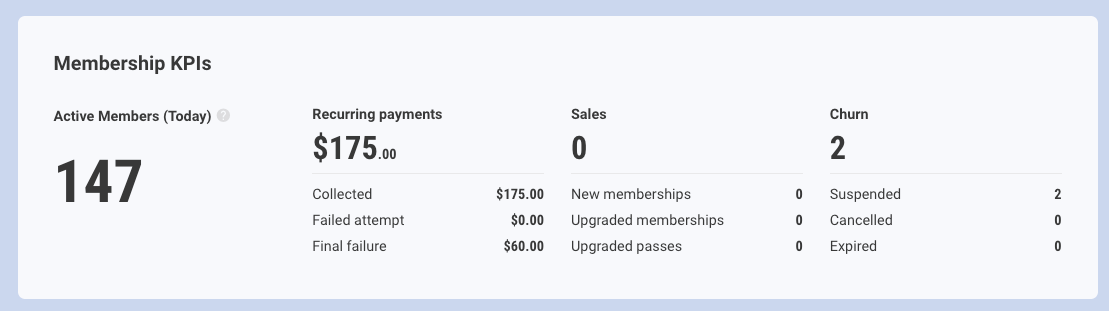
Track how your membership base is changing day to day (eg how many members joined or left).
Metric | Description |
|---|---|
Active members (today) | This is the number of unique recurring membership products that are active today (current, pending activation or pending cancellation). This doesn't include any members who purchased a fixed membership. |
Recurring payments | These amounts come from the Recurring Payment Log report:
The Recurring payments amount adds up Collected and Failed attempt, so it includes payments ROLLER is still trying to collect. It doesn’t include Final failure. |
Sales | These numbers come from the Membership Status Log report. Each one counts status changes on the selected date:
The total also counts renewed memberships, which don't have their own line. |
Churn | These numbers come from the Membership Status Log report. Each one counts memberships that moved from a status in the Active group (eg Current) on the selected date:
|
Accumulated product sales
Seeing which products sold best on the day helps you decide what to promote.
Column | Description |
|---|---|
Product | This displays the products purchased on the selected date. It does not include sales for stock items or add-ons. |
Distribution | Displays the sales split between the different ticket types within a product. You can view the distribution by hovering over the pie chart. |
Total sales | Displays the quantity of sales for the particular product on the selected date. |
Funds received ($) | Displays the total value of payments processed for that particular product on the selected date. |
The Detailed Product Sales report allows you to drill down into the data further for the selected date or period of time.